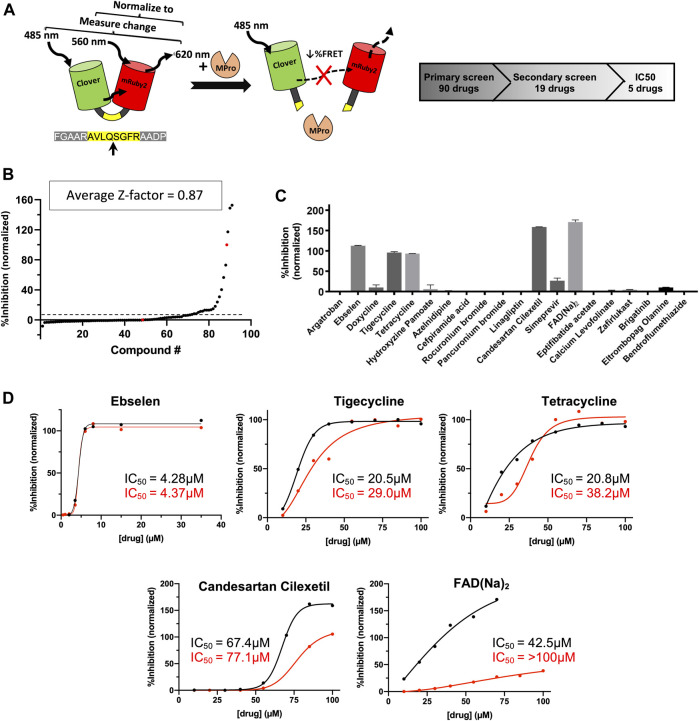
FIGURE 2.
Predicted Mpro drug inhibitors screened using a FRET-based protease assay with five down-selected hits. (A) A schematic of the FRET-based SARS-CoV-2 main protease assay is shown along with the hit identification overview. (B) Purified Mpro and FRET substrate proteins were incubated in the presence of 100 μM of drugs from a library of computationally predicted Mpro inhibitors. No drug, no protease, and Ebselen were used as controls to calculate the Z-factor for each plate and an average score is displayed above. Red dots indicated no drug (0% inhibition) or no protease (100% inhibition) conditions, while the black dots are the ordered percent inhibition values. (C) Identified hits from the primary screen were re-screened at 100 μM and the FRET values were normalized as percent inhibition values in the bar graph. Experiments were performed in duplicate and the presented results are the average values. (D) Verified compounds form rescreening were subjected to half-maximal inhibitory concentration (IC50) analysis. Presented values are averaged from technical duplicate experiments. Black lines and values represent normalized data from FRET values while the red lines and values represent normalized data from gel electrophoresis (Supplementary Figure S1) and densitometry.

