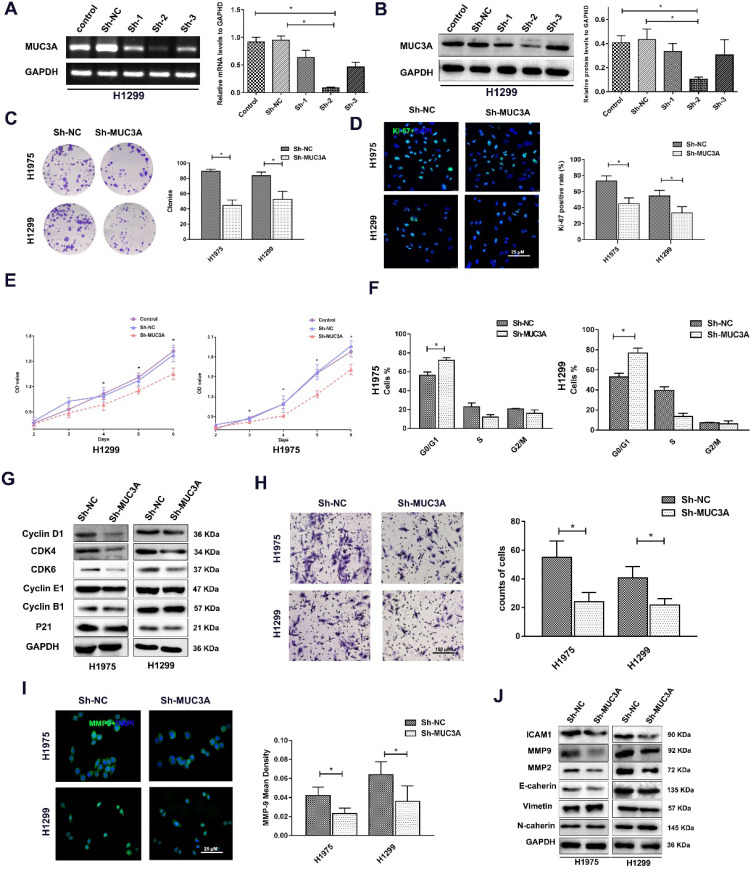
Figure 2.
MUC3A knockdown attenuated NSCLC cell proliferation, migration, and invasion. (A) PCR analysis to detect the knockdown effects of different shRNAs. shRNA-2 was more efficient than the others in H1299 cells. (B) WB analysis to detect the knockdown effects of different shRNAs in H1299 cells. (C) Representative images of crystal violet stain on Day 15. (D) Representative images of Ki-67 IF staining in H1975 and H1299 cells. (E) CCK-8 array to detect cell proliferation. (F) FACS analysis to detect the cell cycle distribution. More cells in the MUC3A knockdown group were accumulated at G0/G1. (G) Immunoblotting analysis of protein abundance of Cyclin D1, CDK4, CDK6, Cyclin E1, Cyclin B1, p21. (H) Transwell assay for cell migration and invasion. The MUC3A knockdown group had significantly fewer migration and invasion cells than the control group. (I) Representative images of MMP9 IF staining in H1975 and H1299 cells. MUC3A knockdown reduced MMP9 expression. (J) Western blotting analysis of protein abundance of ICAM1, MMP2, MMP9, E-cadherin, Vimentin, and N-cadherin. *, p < 0.05.

