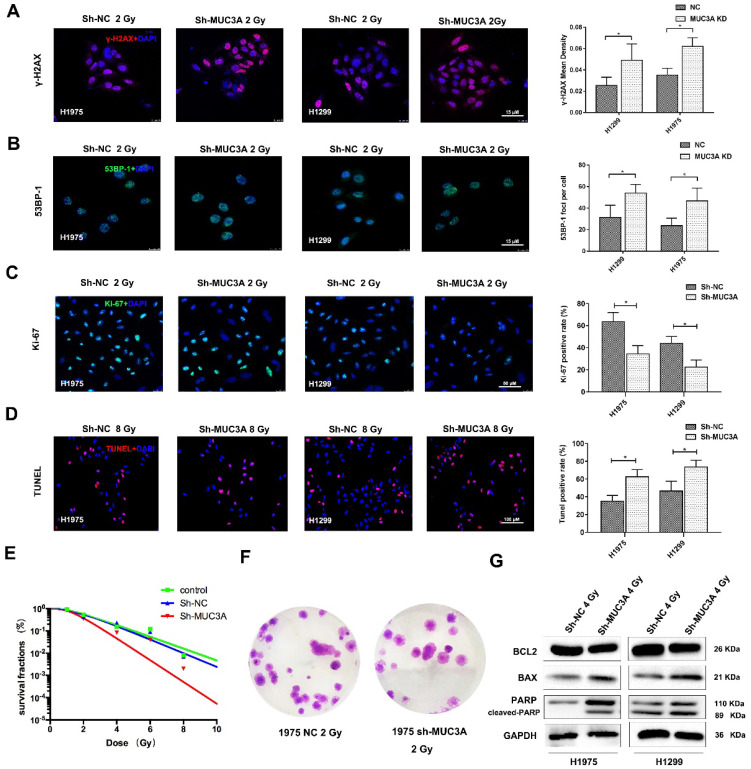
Figure 4.
MUC3A knockdown induced more DNA damages by X-rays. (A) Representative images of γ-H2AX IF staining in H1975 and H1299 cells. (B) Representative images of 53BP1 IF staining in H1975 and H1299 cells. (C) Representative images of Ki67 IF staining in H1975 and H1299 cells. (D) Representative images of TUNEL staining in H1975 and H1299 cells. (E) The multitarget-single-hitting model was used to fit the survival curve. The survival fraction of MUC3A knockdown cells was significantly lower than that of the control groups. (F) Representative crystal violet staining photos of H1975 parental and MUC3A knockdown cells with 2 Gy irradiation. (G) Western blotting analysis of BLC2, BAX, and PARP protein levels. *, p < 0.05.

