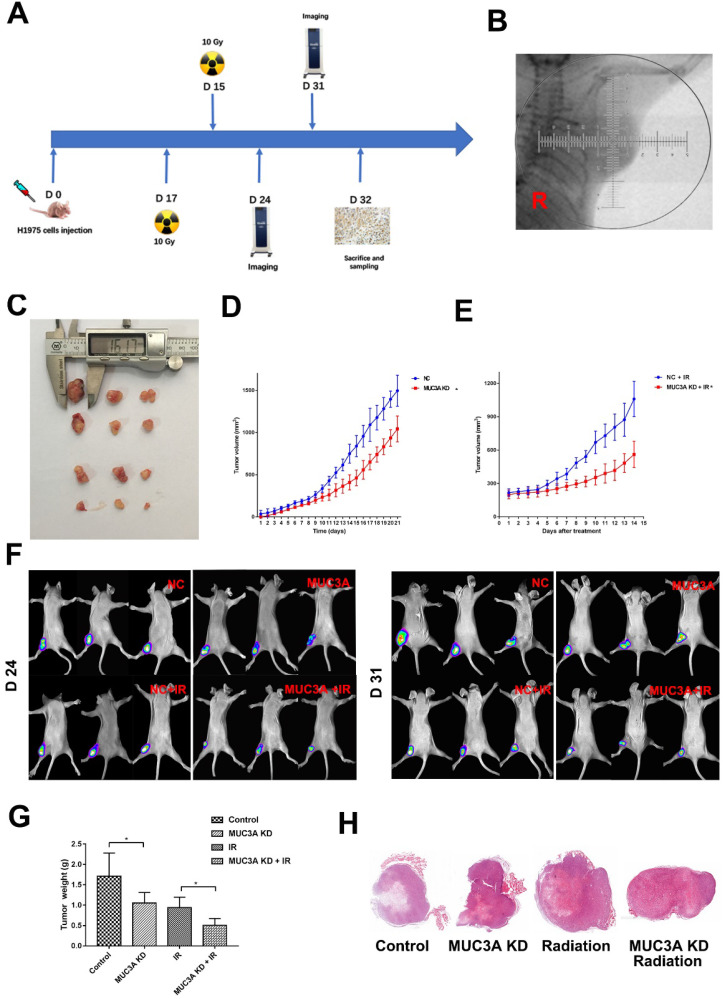
Figure 6.
MUC3A knockdown impaired tumor growth and promoted radiosensitivity in vivo. (A) Treatment schema. (B) Gross view of the tumors. (C) Growth curve of tumor volume for the group without radiotherapy. (D) Growth curve of tumor volume for the group with radiotherapy. (E) In vivo imaging of the size and destiny of GFP-H1975 cells on Days 24 and 31. (F) Tumor weight was significantly different between the control and MUC3A knockdown groups with or without radiotherapy. (G) HE staining was applied to investigate the size and shape of tumor and pathological characters. All the masses were identified as a malignant tumor, and the shapes were similar to H1795 cells. More necrosis was observed in the control group. *, p < 0.05.

