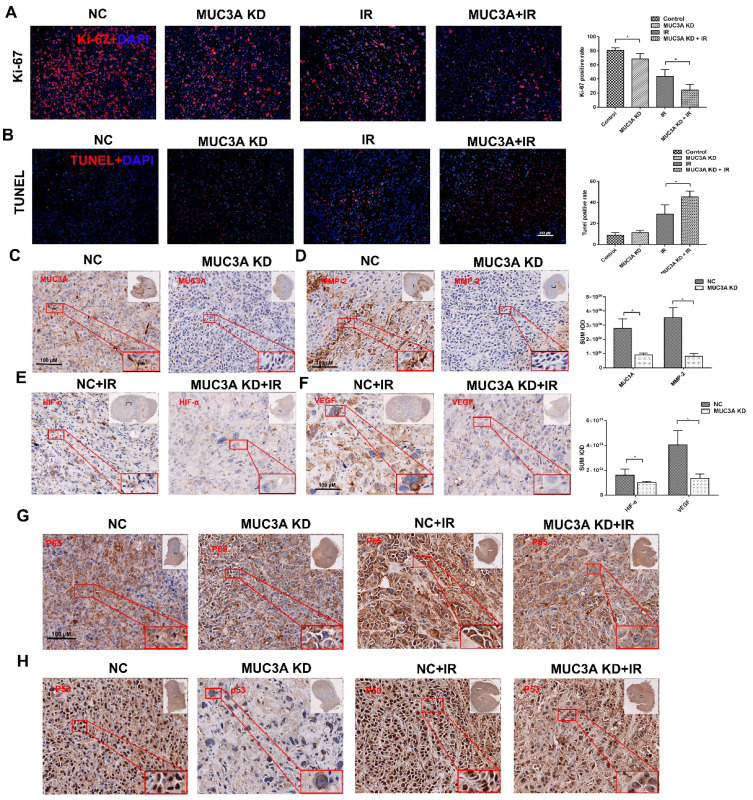
Figure 7.
Knockdown of MUC3A presented a comprehensive anti-tumor effect in vivo. (A) Representative images of Ki-67 IF staining in tumor tissues. (B) Representative images of TUNEL staining in tumor tissues. (C) Representative IHC images of MUC3A. The MUC3A knockdown cells had less MUC3A expression than the control. (D) Representative IHC images of MMP2. (E) Representative IHC images of HIF1α. (F) Representative IHC images of VEGF. (G) Representative IHC images of P65. (H) Representative IHC images of TP53. *, p < 0.05.

