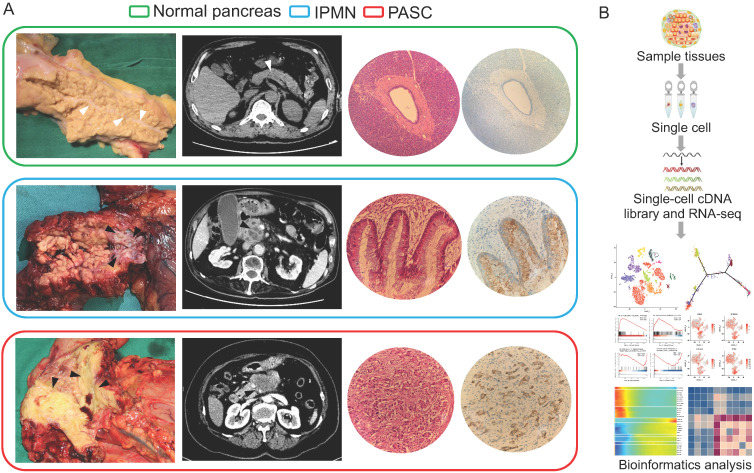
Figure 1.
Clinicopathological manifestations of the normal pancreas, IPMN, and PASC samples. (A) Gross specimens, axial computerized tomography images, hematoxylin-eosin images, and immunohistochemical staining of the normal pancreas (top), IPMN (middle), and PASC (bottom; 200×). White triangles indicate the main pancreatic duct of the normal pancreas, and the black triangles indicate the tumors of IPMN and PASC. (B) Single-cell RNA-seq workflow and subsequent bioinformatics analysis.

