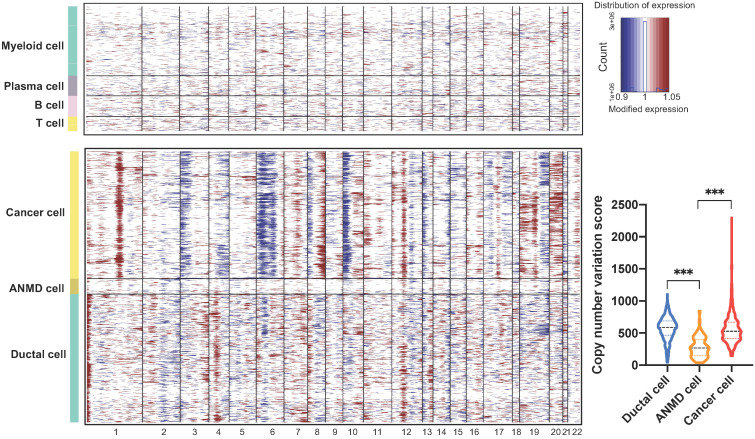
Figure 10.
Copy number variation profiles of ductal, adjacent nonmalignant, and PASC cells. Large-scale CNVs of reference cells including myeloid, plasma, B, and T cells (top); PASC, adjacent nonmalignant ductal (ANMD), and ductal cells (bottom). The red and blue colors represent high and low CNV scores, respectively. The CNV levels of PASC and ductal cells exceed that of ANMD cells (low right). ***P < 0.001. Data are presented as mean ± SD.

