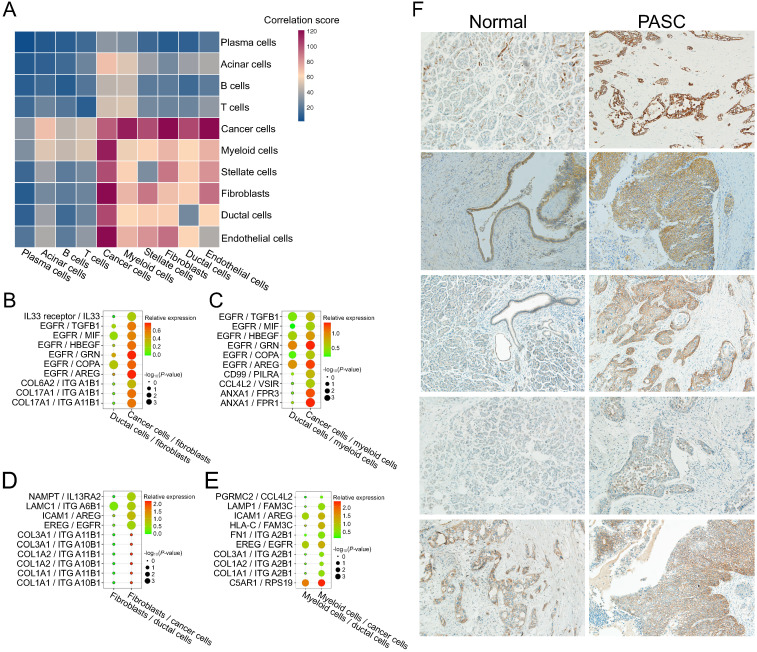
Figure 11.
Cell-cell communication between stromal and PASC cells. (A) Heatmap exhibiting cell-cell communication scores. Dark red and blue colors represent high and low levels of interactional intensity, respectively. Activated intercellular signaling between fibroblasts and cancer cells (B), myeloid cells and cancer cells (C), fibroblasts and cancer cells (D), and myeloid cells and cancer cells (E) compared with ductal cells. (F) EGFR immunohistochemical staining of five paired PASC tissues. (200×)

