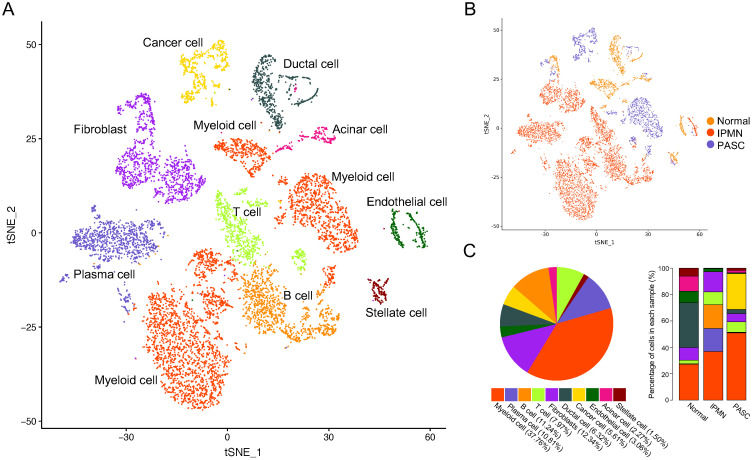
Figure 2.
A total of 9,887 single cells were clustered into ten subgroups based on scRNA-seq. (A) tSNE plot showing ten cell types in tissues of the normal pancreas, IPMN, and PASC. (B) Cell distribution across three pancreatic samples. (C) Percentage of cell types in the whole (left) and parts of pancreatic specimen (right).

