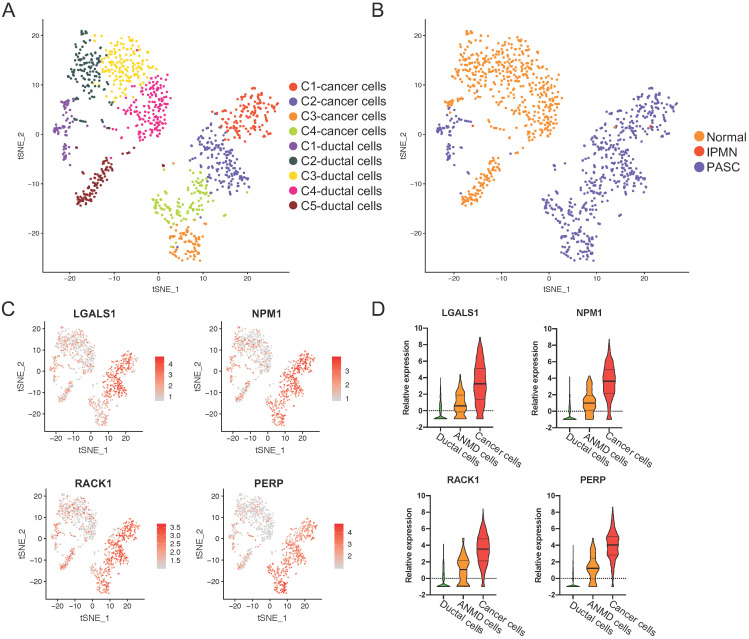
Figure 5.
The upregulated genes across ductal, adjacent nonmalignant, and PASC cells. (A) tSNE plot showing four cancer cell clusters and five duct-cell clusters. (B) Total cell distribution suggesting that C1 of ductal cells is derived from the adjacent normal tissue in PASC. (C) tSNE plot showing the expression level and distribution of LGALS1, NPM1, RACK1, and PERP in ductal and PASC cells. The red bar indicates relative gene expression level. (D) The relative expression levels of LGALS1, NPM1, RACK1, and PERP in ductal, adjacent nonmalignant ductal (ANMD), and cancer cells. Data are presented as mean ± SD.

