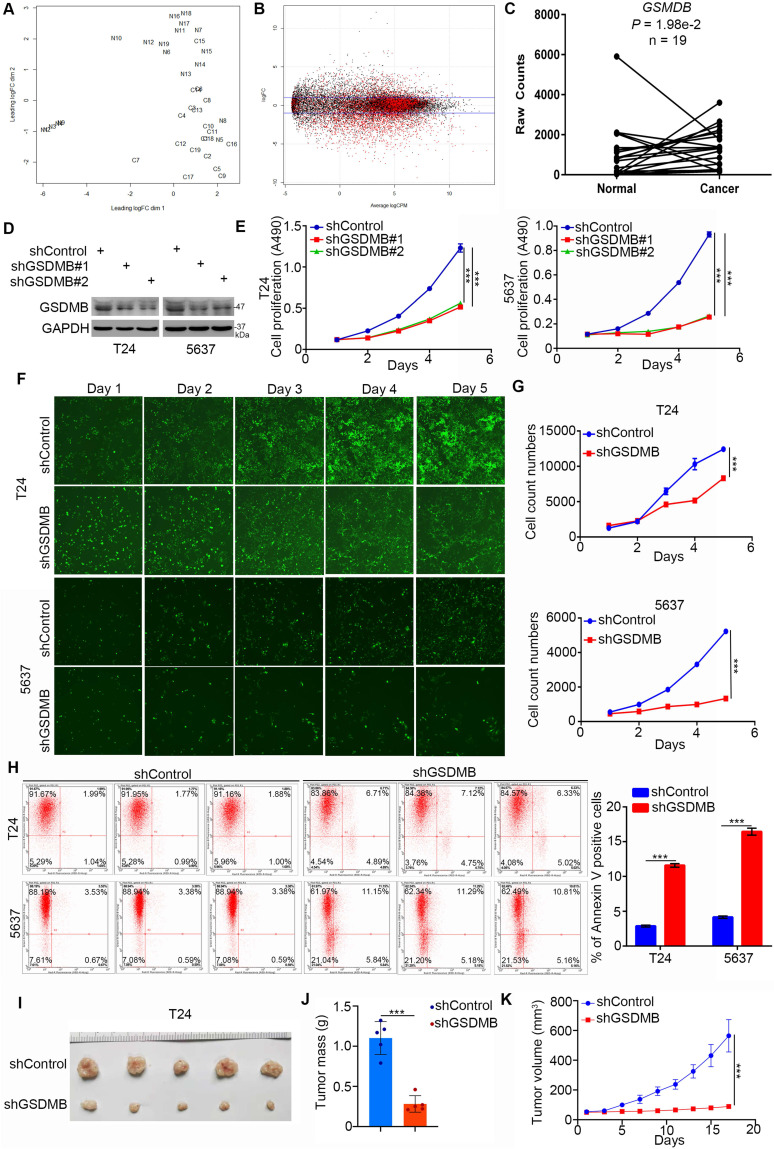
Figure 1.
GSDMB promotes bladder cancer progression in vitro and in vivo. A-C. Analysis of RNA-Seq data from the TCGA dataset of bladder cancer containing 19 paired bladder cancer specimens and adjacent normal tissues. Panel A showed that normal and cancer tissues could be separated by dim2, which indicated that the data is stable for subsequent analysis. Panel B is the general linear model to estimate whether there are differences among different groups of genes. The genes with P value less than 0.05 are considered as differentially expressed genes in accordance with the zero hypothesis (the red dot in the figure). Panel C indicated that GSDMB is upregulated in the above RNA-Seq dataset with P = 1.98e-2. D-G. T24 and 5637 cell lines were infected with constructed plasmids. After infecting 72h, all cells were harvested for Western Blotting analysis (D), MTT assay (E) and celigo fluorescence cell count assay (F and G). All data were presented as Means ± SD (n = 3). ***, P < 0.001. H. T24 and 5637 cells were transfected with constructed plasmids for 72h. All cells were harvested and subjected to Annexin-V/APC assay. All data were showed as Means ± SD (n = 3). ***, P < 0.001. I-K. T24 cells were infected with constructed lentivirus to establish the stable knocking down cell lines. Then cells were injected subcutaneously into the nude mice to construct xenograft transplantation model. The image of xenografts was shown in (I), the tumor mass and volume were measured in (J and K). All data were presented as Means ± SD (n = 6). ***, P < 0.001.

