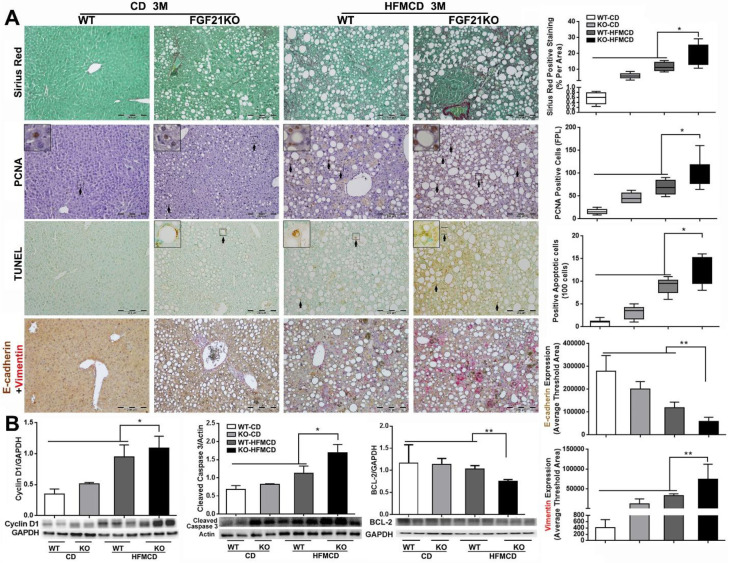
Figure 5.
A: Representative images of Sirius Red staining, PCNA and TUNEL by IHC staining, E-cadherin/Vimentin by a dual IHC staining along with computer-imaging analysis in liver tissues from advanced NASH model and controls. B: Western blot analysis for the protein levels of cyclin D1, cleaved caspase-3 and BCL-2 in liver tissues from advanced NASH model and controls. WT: wild type; KO: FGF21KO; CD: control diet; and HFMCD: high fat methionine-choline deficient. FPL: field per low power. *, p<0.05; **, p<0.01.

