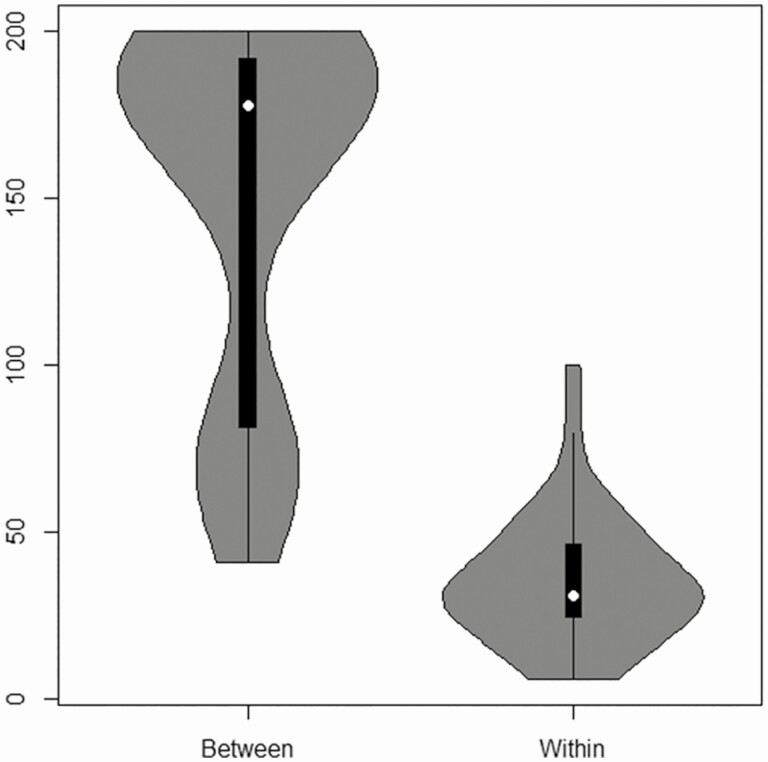
Figure 2.
Distribution of the number of SNPs for isolate pairs between individuals with fewer than 200 SNPs (between) compared to pairs of isolates from the same individual with a PFGE match (within). Supplementary Figure 5 indicates that the isolate pairs between individuals are a visual PFGE match. Abbreviations: PFGE, pulsed-field gel electrophoresis; SNP, single-nucleotide polymorphism.

