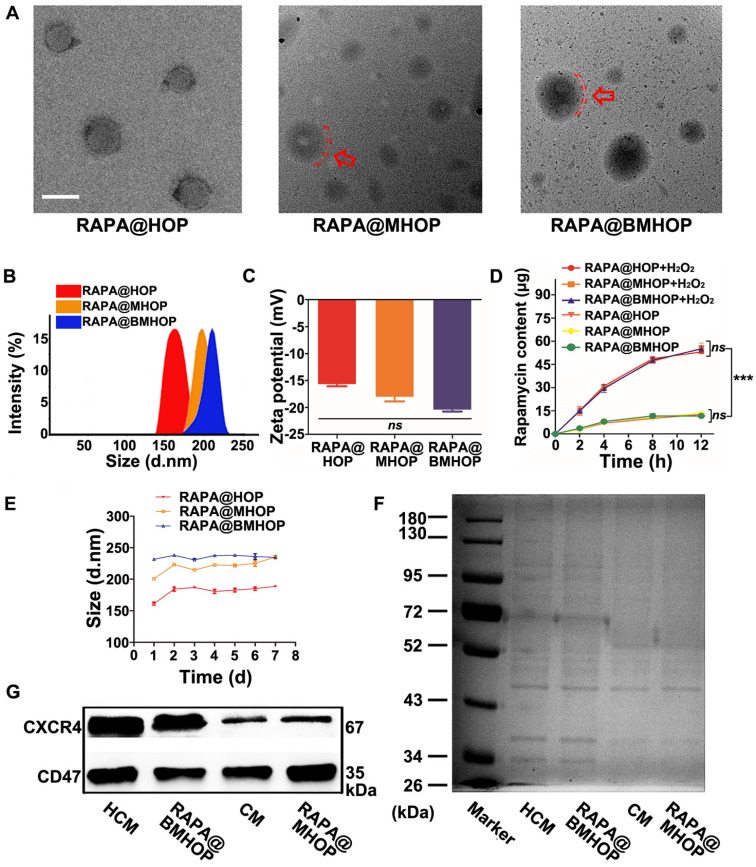
Figure 1.
Characterization of bioengineered cell membrane-coated NPs. (A) TEM image of RAPA@HOP, RAPA@MHOP, and RAPA@BMHOP (scale bar = 200 nm; inside. red dashed circles represent the cell membrane). (B) Hydrodynamic size distribution and (C) ζ potential of RAPA@HOP, RAPA@MHOP, and RAPA@BMHOP (values represent mean ± SD, n = 3). (D) Drug release of different NPs and (E) Stability of NPs in 0.01 M PBS at room temperature (values represent mean ± SD, n = 3). (F) SDS-PAGE protein analysis and (G) Western blotting of indicated proteins.

