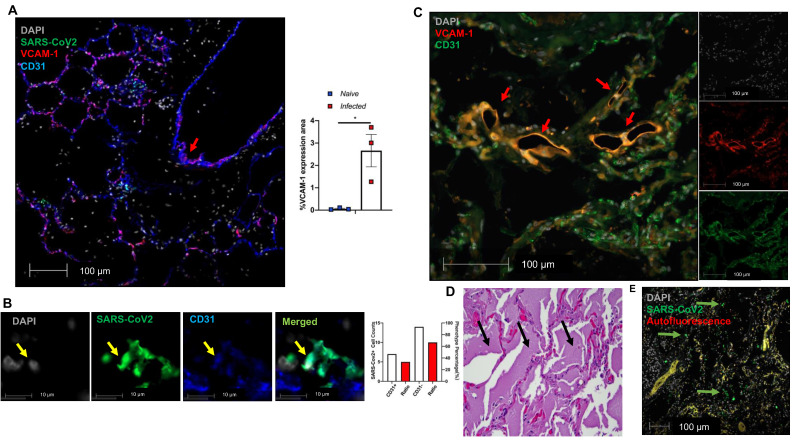
Figure 5.
Extensive EC activation and infection in SARS-CoV-2 infected AGMs and human. (A-B) Co-staining of viral protein (green, yellow arrow in Fig. 5B), CD31 (blue) and VCAM1 (red) in lung sections from SARS-CoV-2-infected AGMs. (A) Co-localization of VCAM1 and CD31 (red arrow). Graph shows the quantification of VCAM1 expression in SARS-CoV-2-infected and naïve AGMs. The data shown is the VCAM1 positive area/lung area x100 %. (n = 3 for each group). (B) Co-localization of SARS-CoV-2 protein (green) and CD31 (blue); Nuclei are stained with DAPI (white). Quantification of cell counts (left axis) and percentage of CD31+ and CD31- cells (right axis) of total infected cells. (C-E) EC dysfunction in an archived lung of autopsied COVID-19 patient. The patient was a 78-year-old female with a history of end-stage renal disease, type 2 diabetes and obesity who presented in cardiac arrest after a two-day history of shortness of breath. (C) Lung sections exhibit co-staining (arrows) of VCAM1 (red) and CD31 (green). (D) H&E stains demonstrate abundant, acute, pulmonary edema (black arrows). (E) SARS-CoV-2 positive cells (green) are scattered throughout sections of the lung (green arrows).

