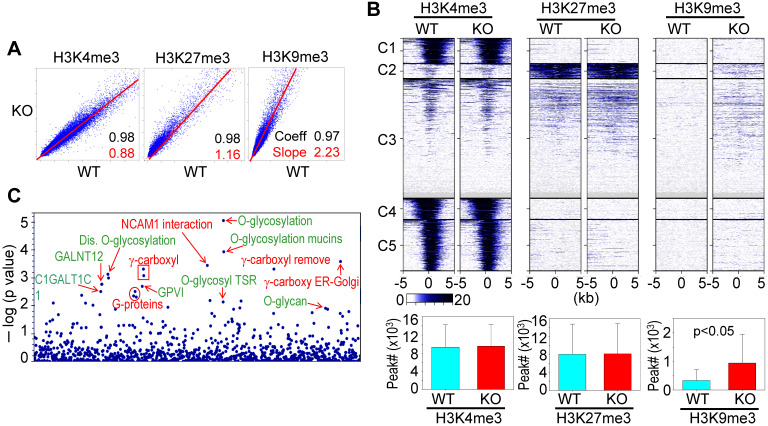
Figure 2.
ChIP-seq data revealed that mdig is antagonistic to H3K27me3 and H3K9me3. A. Pairwise Pearson correlation analyses were made through plotting the tag numbers of H3K4me3, H3K9me3 and H3K27me3 in the genome in mdig KO cells against the corresponding tag numbers in WT cells. B. Clustered heatmaps of ChIP-seq for H3K4me3, H3K27me3 and H3K9me3 in the promoter regions of WT cells and mdig KO cells. Bar graphs at the bottom show the total numbers of the indicated peaks in all regions of the genome in WT and mdig KO cells. C. Reactome pathway analysis of the genes showed significantly enhanced enrichment of H3K9me3 in mdig KO cells. The top-ranked pathways in glycan metabolism are marked in green color.

