Figure 4.
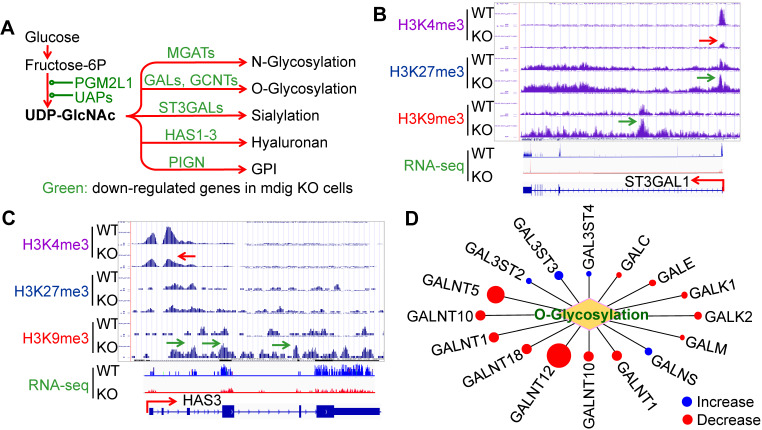
Depletion of mdig decreased expression of the genes in protein glycosylation. A. Diagram shows glucose metabolism and hexosamine biosynthetic pathway linked to glycan metabolism and glycosylation. The down-regulated genes in mdig KO cells are marked in green. B and C. Screenshot of ChIP-seq and RNA-seq for ST3GAL1 that catalyzes sialylation and HAS3 that catalyzes the generation of hyaluronan, respectively. Knockout of mdig enriched H3K9me3 and decreased H3K4me3, leading to the diminishment of the ST3GAL1 and HAS3 mRNA in RNA-seq. D. Down-regulation of O-glycosylation pathway genes in mdig KO cells. Red circles denote decreased, while blue circles denote an increased expression of the genes in mdig KO cells. The sizes of circles indicate the degree of increase or decrease of these gene expressions in mdig KO cells.

