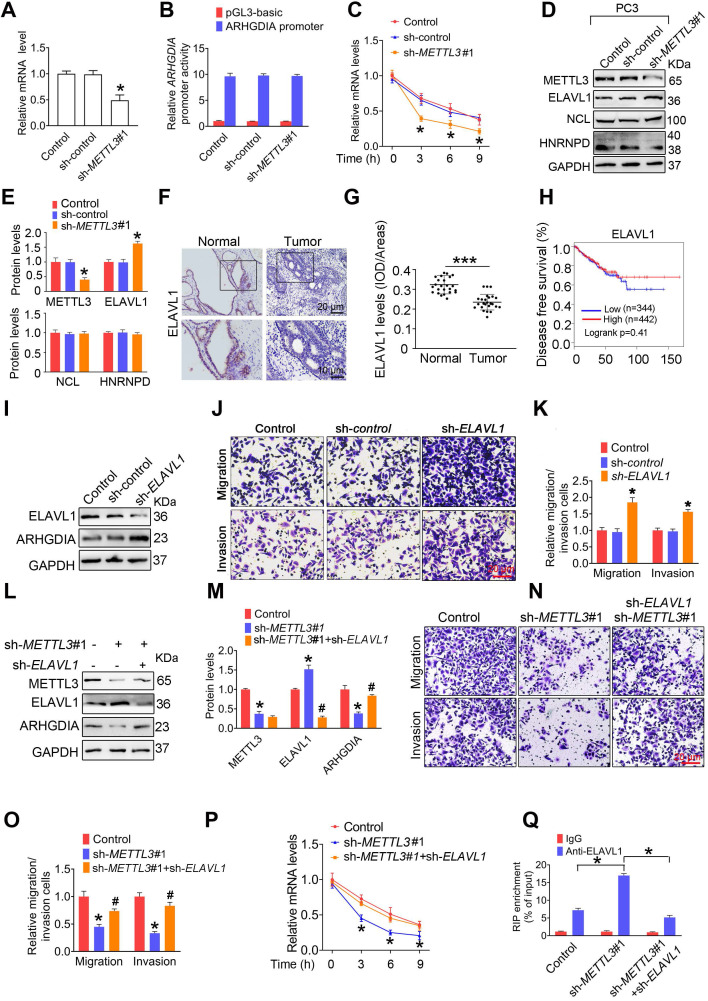
Figure 4.
ELAVL1 reduces ARHGDIA mRNA stability and prostate cancer (PCa) metastasis. A-E, PC3 cells were transfected with shRNA targeting METTL3 (sh-METTL3). The ARHGDIA mRNA levels in indicated cells were determined by qRT-PCR assay (A). The ARHGDIA promoter constructs were transfected into PC3 cells, and luciferase activity was measured (B). PC3 cells were treated with actinomycin D (5 µg/mL) for 2 h, followed by measurement of ARHGDIA mRNA levels at indicated times (C). Protein levels of ELAVL1, NCL, and HNRNPD were determined by western blotting and quantitatively analyzed (D, E). Data were presented as means ± SEM (n = 3), * p < 0.05 vs. the control cells. F-G, Immumohistochemical staining was performed to evaluate the expression of ELAVL1 in 25 paired human PCa tissues and their adjacent normal prostate tissues (F), and ELAVL1 protein levels (G) were analyzed by calculating the integrated optical density per area (IOD/area). Data were presented as means ± SEM (n = 25), *** p < 0.001. H, Correlation between ELAVL1 mRNA expression and survival of PCa patients was analyzed using Kaplan-Meier survival curve analysis methods based on the TCGA database. I-K, PC3 cells were transfected with sh-ELAVL1. Protein levels of ELAVL1 and ARHGDIA were determined by western blotting (I). The migration and invasion abilities of indicated cells were evaluated. Representative images (J) and quantification of the cell migration and invasion assay results were shown (K). Data were presented as means ± SEM (n = 5), * p < 0.05 vs. the control cells. L-P, PCa cells were transfected with sh-METTL3 before transfection with sh-ELAVL1. Protein levels of METTL3, ELAVL1, and ARHGDIA were determined by western blotting and quantitatively analyzed (L, M). The migration and invasion abilities of indicated cells were evaluated. Representative images and quantification of the cell migration and invasion assay results were shown (N, O). PC3 cells were treated with actinomycin D (5 µg/mL) for 2 h, followed by measurement of ARHGDIA mRNA levels at indicated times (P). Data were presented as means ± SEM (n = 3), * p < 0.05 vs. the control cells, # p < 0.05 vs. the sh-METTL3-treated cells. Q, ELAVL1 was immunoprecipitated, followed by qRT-PCR assay to evaluate the association of the ARHGDIA transcripts with ELAVL1 protein. Data were presented as means ± SEM (n = 3), * p < 0.05.

