Figure 5.
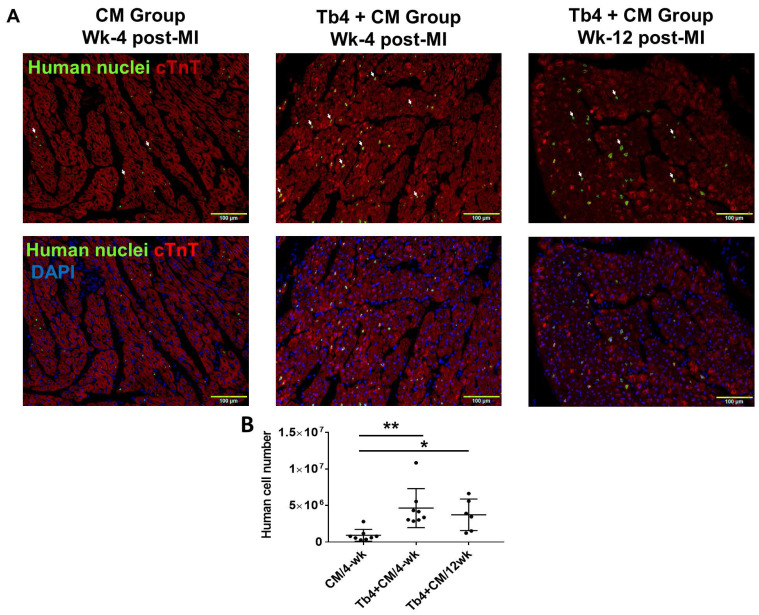
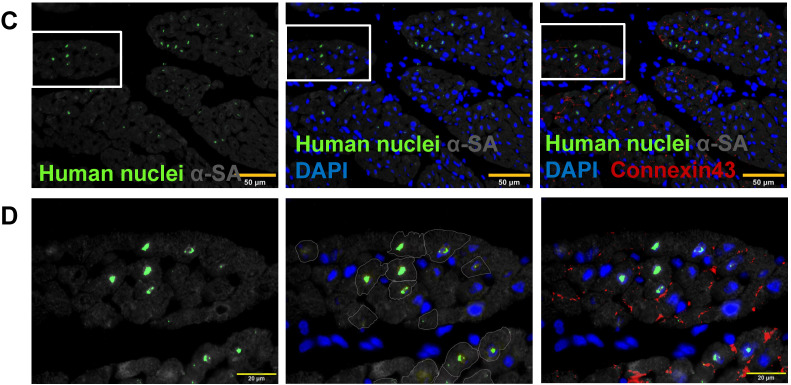
Co-treatment with Tb4 enhanced hiPSC-CM engraftment in porcine hearts after MI and treatment. (A) Representative images of fluorescence immunostaining for human nuclei and cardiac troponin T (cTnT) expressions in pig hearts of the CM Group at weeks -4 and the Tb4 + CM Group at weeks -4 and -12 after MI and treatment. (Bar = 100 μm. White arrows indicate representative CMs expressing human nuclei antigen). (B) Quantification of human cell engraftments in pig hearts of the CM and Tb4 + CM Groups. (C) Connexin43 protein expression between implanted hiPSC-CMs and host pig CMs (Bar = 50 μm). (D) The selected areas from C were magnified. (Bar = 20 μm). Lines were drawn to define the morphology of engrafted hiPSC-CMs. (n = 8 or 6 for each group, One-way ANOVA: *: p < 0.05; **: p < 0.01). Values are presented as the means ± SD.


