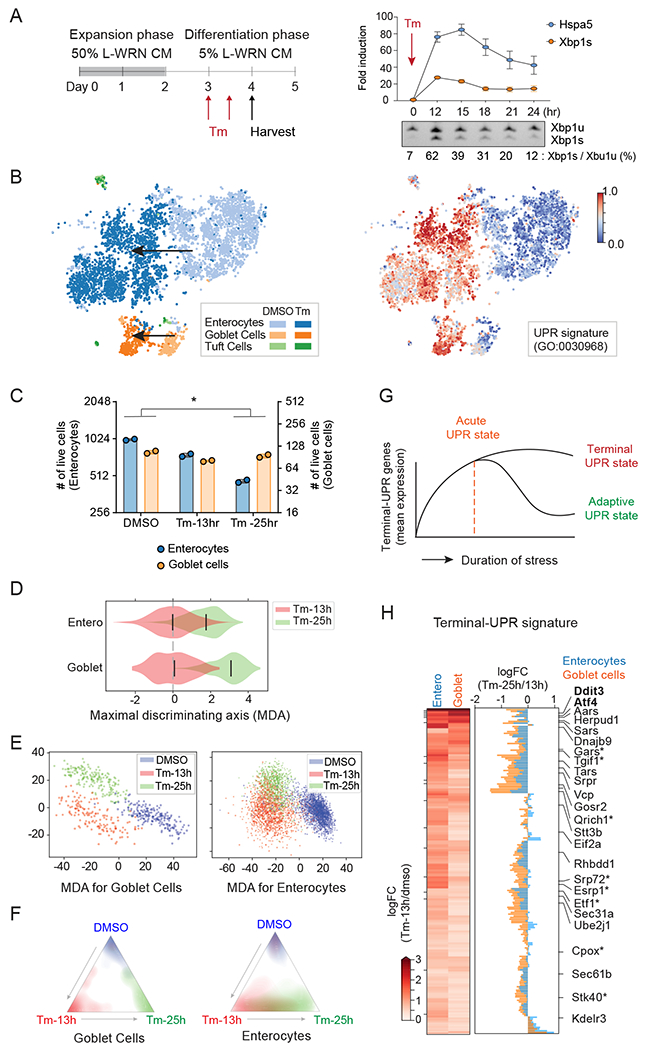
Fig. 1. Temporal scRNA-seq identifies gene expression signature of terminal-UPR.

(A) Experimental timeline for differentiation of intestinal organoids into monolayers and treatment with Tunicamycin (Tm). Right upper panel shows a 24-hour time course of Hspa5 and Xbp1s expression levels upon treatment with 0.5ug/ml of Tm (n=3, error bars, mean +/− SD). Right lower panel shows the ratio of Xbp1s vs. Xbp1u transcripts (n=3). Xbp1u, unspliced transcript; Xbp1s, spliced transcript.
(B) ScRNA-seq tSNE plots recover known cell-types from primary intestinal monolayer cells (left) and identify transcriptomic signatures of UPR (right, colored by cell ranking). Arrows indicate the Tm-mediated positional shift.
(C) The number of enterocytes and goblet cells in each condition in scRNA-seq (n=2, unpaired student t-test; *p<0.05). Goblet cells exhibit stronger resistance to prolonged UPR stress than enterocytes.
(D and E) Violin (D) and scatter (E) plots of cells along the transcriptomic MDA between 13h and 25h (D) and MDAs among DMSO, 13 h, and 25 h (E). Goblet cells show more clearly distinct states between 13 h and 25 h Tm treatments compared to enterocytes. In D, bars indicate median values, and mean expression at 13 h is chosen as the baseline.
(F) Linear discriminant analysis predictions show distinct and overlapping states of goblet cells (left) and enterocytes (right). Colors and coordinates, respectively, indicate the ground truths and predicted probabilities of stimulation using scRNA-seq.
(G) The schematic diagram for the cellular state during ER stress. We hypothesized that terminal-UPR genes are up-regulated in the early phase of ER stress, and their persistent expression promotes UPR-mediated apoptosis under unresolved ER stress.
(H) Heatmap shows the logFC of terminal-UPR genes in Tm-13h vs DMSO. Barplot shows the logFCs between Tm-25 h and Tm-13 h in enterocytes and goblet cells. Our gating strategy identified 192 terminal-UPR genes. Known and novel UPR genes are shown (novel terminal-UPR regulators are indicated by an asterisk).
