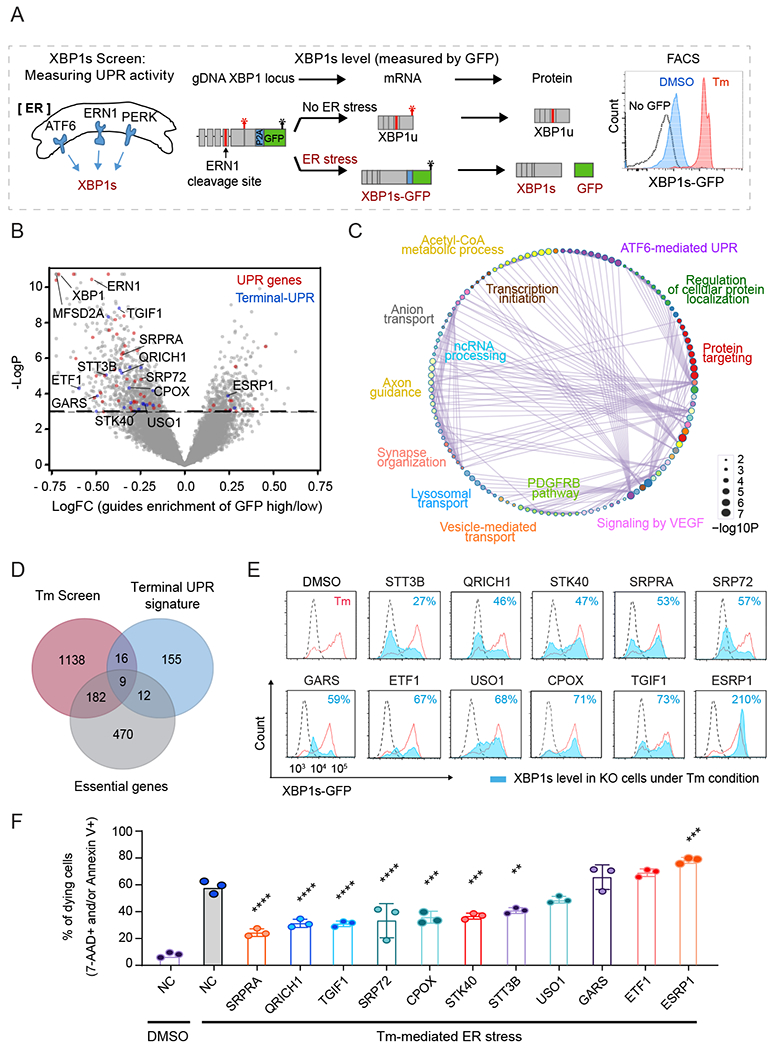
Fig. 2. Genome-wide CRISPR screens unveil gene functional proximities in, and identify novel regulators of, the UPR pathway.

(A) Schematic overview of XBP1s-GFP reporter for CRISPR screen.
(B) Volcano plot of gRNA enrichment reveals putative regulators of the UPR pathway. Dashed line indicates the p-value cut-off (p<0.05). Known UPR genes and terminal-UPR genes are highlighted in red and blue, respectively.
(C) Pathway interaction networks of the screen hits obtained using Cytoscape. The color code indicates pathway nodes, and GO terms represent the most significant pathway in the node. The edges show the crosstalk between the pathways.
(D) Venn diagram of the CRISPR screen, single-cell analysis, and essential genes highlight 16 potent regulators of the terminal-UPR pathway.
(E) Assessment of XBP1s in wild-type (red) or knockout (filled blue) cells treated with Tm by measurement of GFP intensities. Symbol indicates the targeted gene. Dashed black line indicates the GFP intensity in DMSO condition.
(F) Measurement of dying (7-AAD or Annexin V positive) cells treated with Tm for 3 days (n=3, one-way ANOVA (indicated target gene values compared to Tm-treated negative control (NC)); error bars, mean +/− SD). **p<0.01, ***p<0.001, ****p<0.0001.
