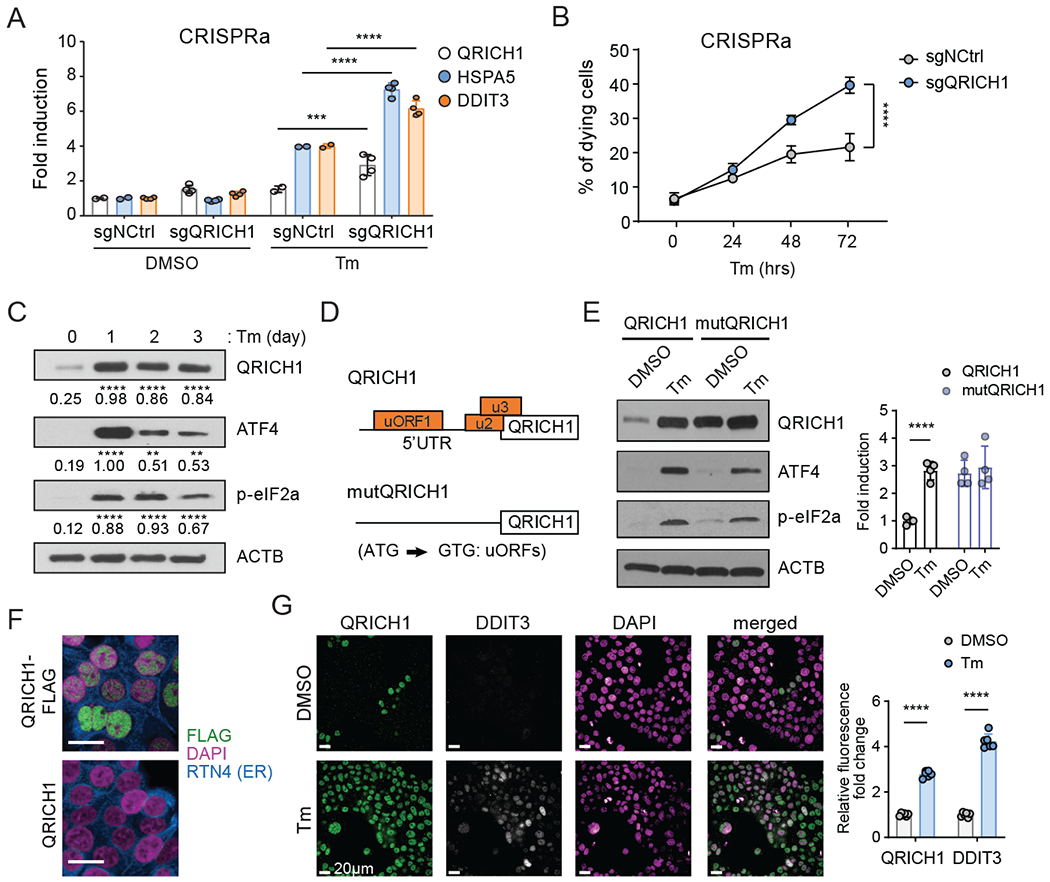
Fig. 3. QRICH1 promotes cell death and its translation is upregulated by the PERK-eIF2α axis under ER stress.

(A) Measuring the transcriptional activity of UPR pathway regulators in control (sgNCtrl) or CRISPRa QRICH1 cells in normal or Tm-mediated ER stress conditions (n=4, two-way ANOVA).
(B) The percentage of 7-AAD positive cells. sgNCtrl or sgQRICH1 cells treated with Tm for the indicated time. Three different guides (n=4, two-way ANOVA).
(C) Immunoblot shows the time-course expression pattern of QRICH1, ATF4, and p-eIF2α during prolonged Tm treatment. A representative blot is shown (n=3, two-way ANOVA, compared to DMSO).
(D) The structure of the wild type 5’UTR (containing three putative upstream ORFs) or mutated 5’UTR (substitution of A to G at the AUG translation start codon of three uORFs) of QRICH1 expression constructs.
(E) Immunoblot shows the protein expression patterns of QRICH1 constructs upon DMSO or Tm treatment. ATF4 and p-eIF2α are used as markers of ER stress (n=4, multiple t-test).
(F) Immunostaining for QRICH1-FLAG (green) or QRICH1 transduced cells. Nuclei and ER are stained with DAPI (magenta) and RTN4 (blue), respectively. Scale bars, 20 μm.
(G) Immunostaining of endogenous QRICH1 (green) and DDIT3 (gray) in cells with DMSO or Tm treatment. Nuclei are stained with DAPI (magenta). Scale bars, 20 μm. Right graph shows the normalized intensities of QRICH1 and DDIT3 (n=6, multiple t-test).
For all above panels, **p<0.01, ***p<0.005, ****p<0.0001; error bars, mean +/− SD.
