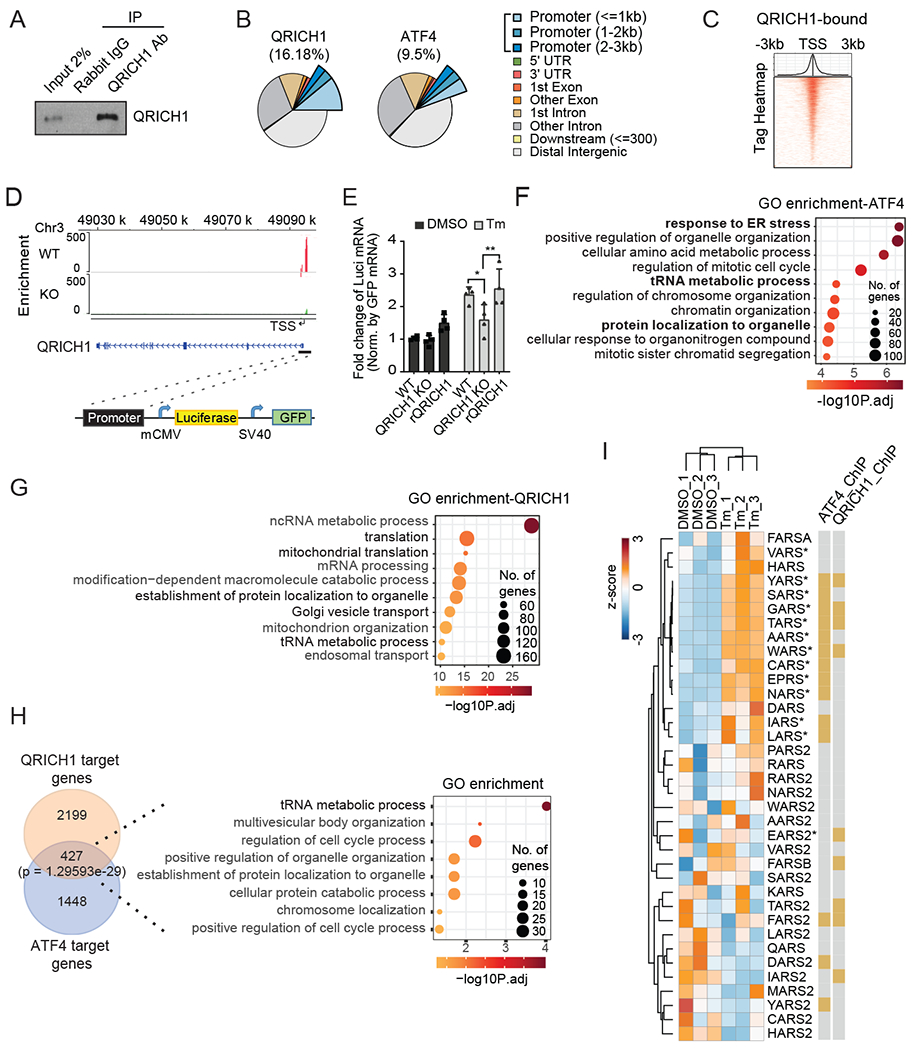
Fig. 4. QRICH1 ChIP-seq identifies QRICH1 as a promoter of protein translation activity.

(A) WT HT29 cells were treated with Tm for 24 hrs and crosslinked by formaldehyde. The cells were immunoprecipitated (IP) by anti-QRICH1 or anti-rabbit IgG and detected by immunoblot analysis.
(B) The genomic annotation of QRICH1 or ATF4 ChIP-seq peaks. Promoter regions are defined as the indicated distance from the transcription start site (TSS).
(C) Peak distribution of QRICH1 ChIP-seq within 3kb from the TSS. Heatmap shows the read density for QRICH1 ChIP-seq.
(D) QRICH1 binding profiles on the QRICH1 promoter region in WT and QRICH1 KO cells. Black bar indicates the cloned genomic region in front of the minimal CMV promoter for the promoter activity reporter assay.
(E) Level of luciferase mRNAs in WT, QRICH1 KO, and QRICH1 reconstituted (rQRICH1) cells transduced with the promoter reporter-expressing lentivirus and treated with DMSO or Tm for 24 hrs. Luciferase mRNA was measured by normalizing GFP mRNA using qRT-PCR (n=3, two-way ANOVA; *p<0.05, **p<0.01; error bars, mean +/− SD).
(F and G) Functional enrichment analysis shows the top 10 enriched gene ontologies from ATF4-binding targets (F) and QRICH1-binding targets (G).
(H) Venn diagram illustrating overlap of QRICH1 and ATF4 targets from ChIP-seq. GO analysis shows that the tRNA metabolic process is the most significant biological process.
(I) RNA-seq shows that QRICH1 and/or ATF4-bounded tRNA synthetases are up-regulated during ER stress (n=3). An asterisk indicates the translationally upregulated genes during ER stress (28).
