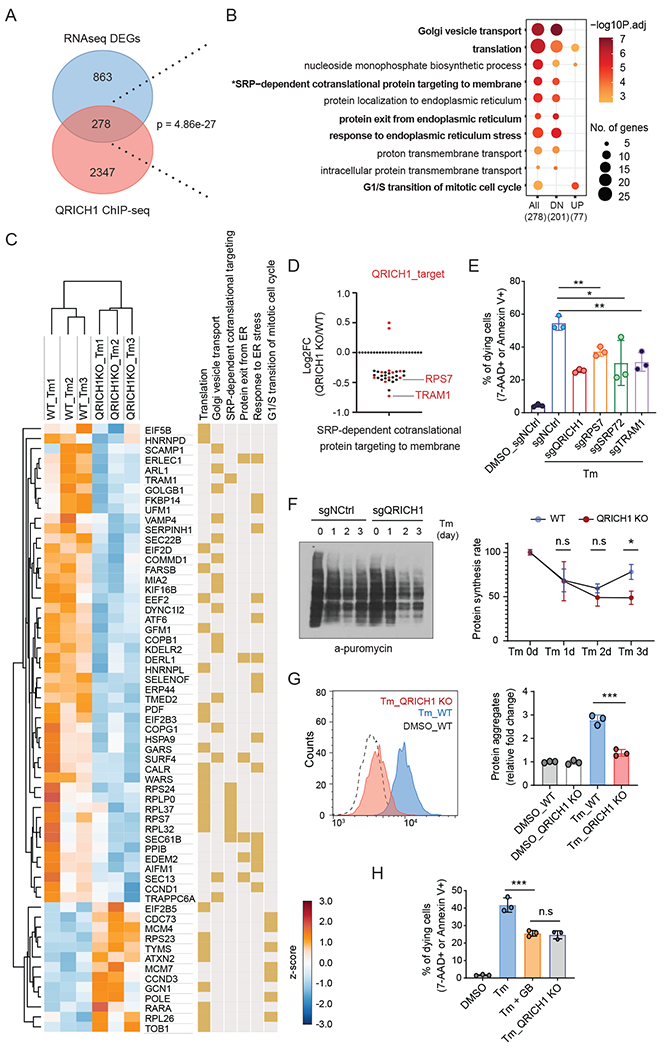
Fig. 5. QRICH1 upregulates protein synthesis and secretion during ER stress.

(A) Venn diagram illustrating the overlap of QRICH1 target genes from ChIP-seq and differentially expressed genes (DEGs) between WT and QRICH1 KO cells in response to Tm treatment.
(B) Functional enrichment analysis of the 278 overlapping gene set in A. All, 278 DEGs; DN, 201 down-regulated genes in QRICH1 KO cells; UP, 77 up-regulated genes in QRICH1 KO cells.
(C) RNA-seq performed with WT and QRICH1 KO cells to show response to Tm treatment. Heatmap shows selective DEGs belonging to specific biological processes (related to Fig. 5B). Yellow color indicates the involved biological processes of that gene.
(D) RNA-seq showed that 28 of 30 DEGs belonging to ‘SRP-mediated cotranslational ER targeting’ are down-regulated in the QRICH1 KO cells. Red dots indicate the QRICH1-target in ChIP-seq data.
(E) Measurement of dying (7-AAD or Annexin V positive) cells treated with Tm for 3 days (n=3, one-way ANOVA; error bars, mean +/− SD). X-axis labels indicate the target gene.
(F) Immunoblot shows the puromycin incorporation rate by anti-puromycin blot. WT and QRICH1 KO cells were pulse-labeled with puromycin after Tm treatment for the indicated times. A representative blot is shown. The graph shows the quantified intensities of anti-puromycin signals, compared to the signal of sgNCtrl-Tm 0hr (set to 100%) (n=3, two-way ANOVA; error bars, mean +/− SD, see Methods).
(G) FACS analysis of WT and QRICH1 KO cells after 72 hrs Tm treatment showing the intensity of the fluorescent dye which preferentially interacts with unfolded protein aggregates (n=3, one-way ANOVA, error bars, mean +/− SD).
(H) FACS analysis of cell viability in WT and QRICH1 KO cells treated with Tm or Tm plus guanabenz (GB) for 72 hrs (n=3, one-way ANOVA; error bars, mean +/− SD). For all above panels, *p<0.05, **p<0.01, ***p<0.001; n.s, not significant.
