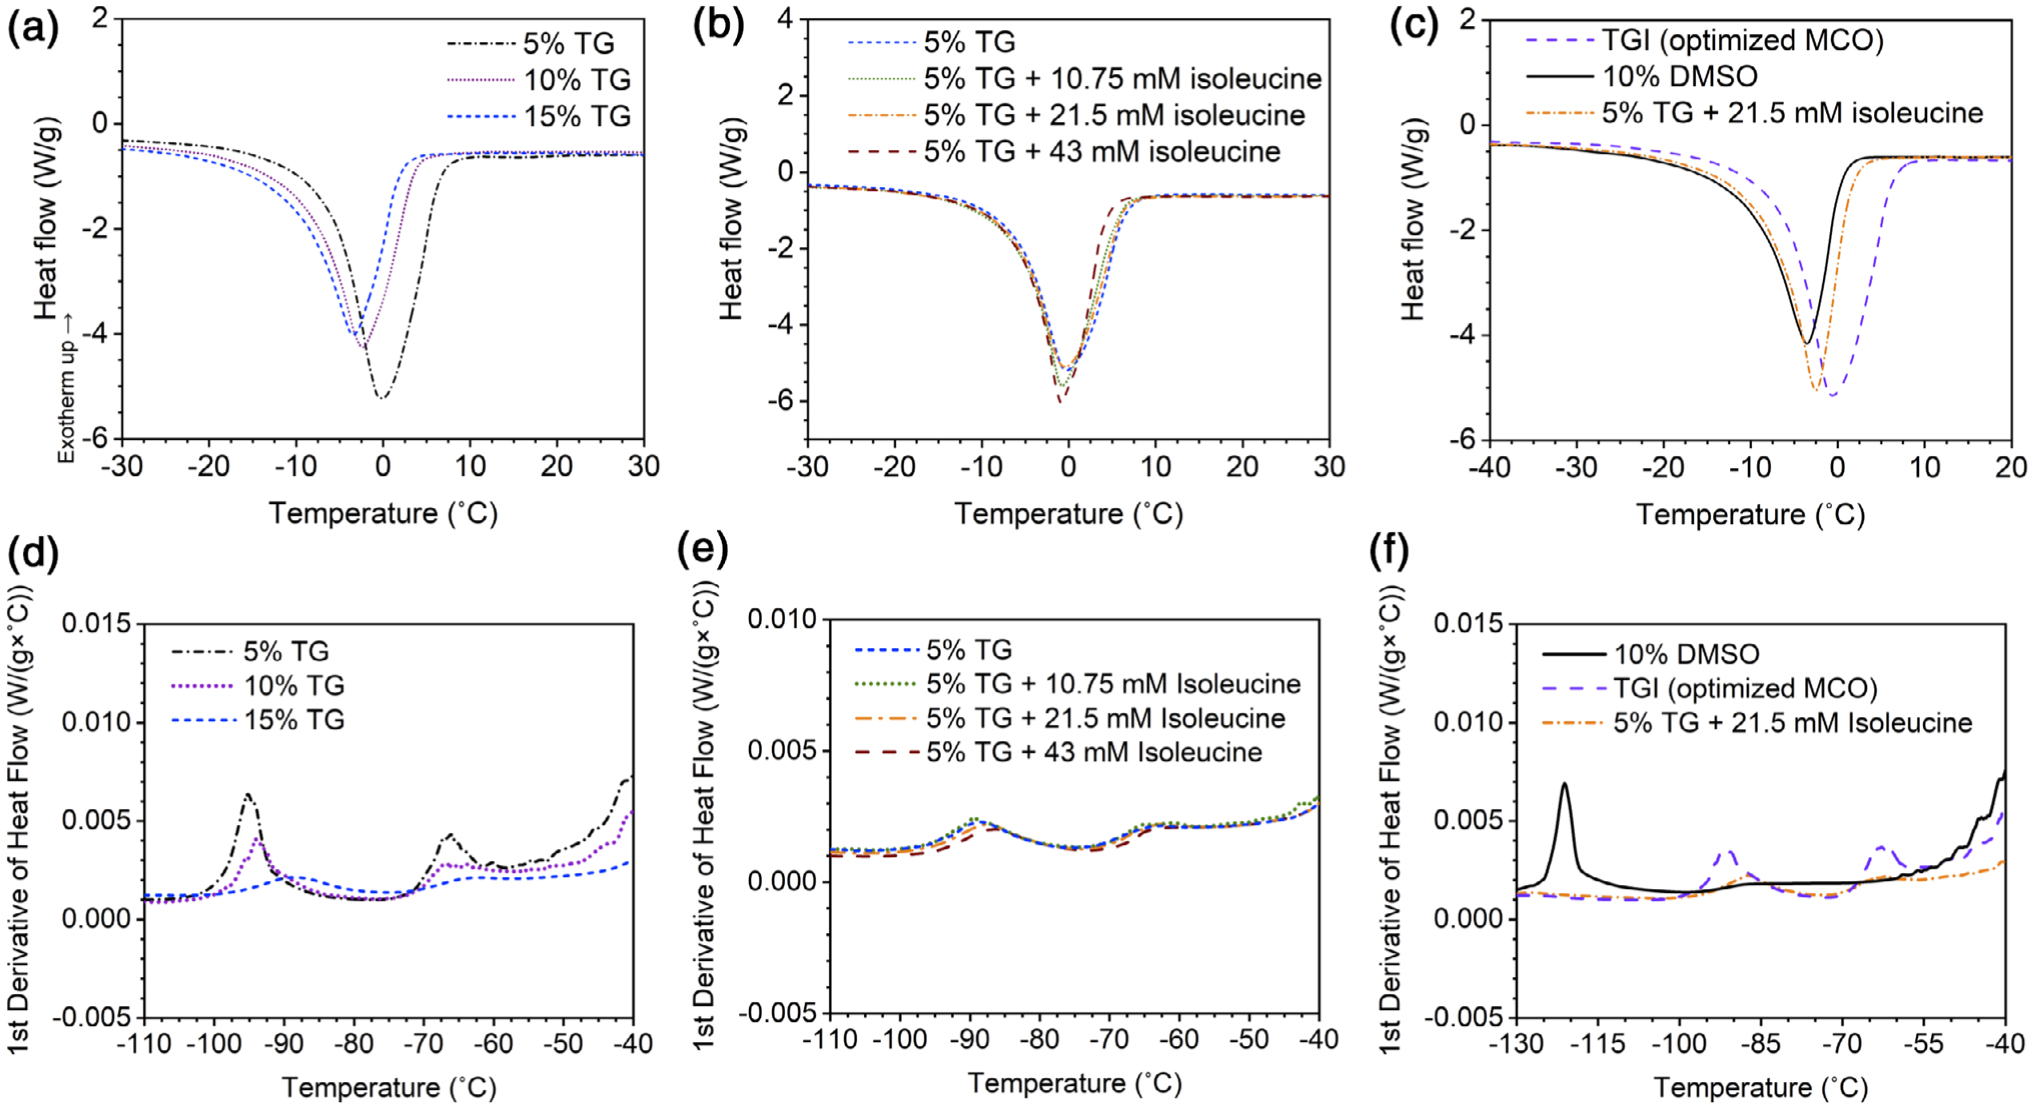
FIGURE 3.

DSC melting profiles (a–c) and glass transitions (d–f) of (a, d) 5, 10, and 15% (wt/vol) T:G in Normosol-R, (b, e) 5% T:G with increasing concentration of isoleucine, and (c, f) 5% T:G with 21.5 mM isoleucine (optimized NADES), TGI (optimized MCO), and 10% DMSO (control)
