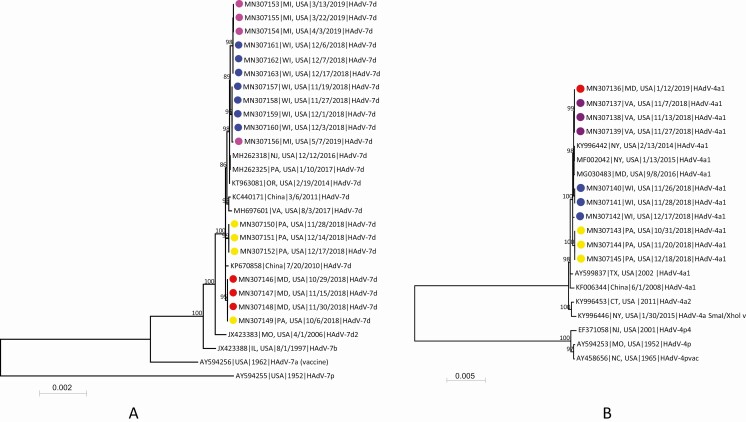
Figure 1.
Phylogenetic analysis of human adenovirus 7 (A) and human adenovirus 4 (B) genomic sequences obtained from students associated with respiratory illness outbreaks in 5 college campuses and reference sequences available in GenBank. Genomic sequences were aligned by using MAFFT implemented in Geneious version 10.0.9, and the maximum-likelihood phylogenetic trees were constructed by using MEGA7 software [20] based on the Tamura 3-parameter nucleotide substitution model. Numbers at selected nodes indicate level of support using 1000 bootstrap replicates. Genomic sequences with colored dots were obtained in this study, and different colors represent sequences from different college outbreaks: red, college A; yellow, college B; purple, college C; blue, college D; pink, college E. Sequences are identified by GenBank accession number, geographic location, sample collection date or year, and virus genome type. Scale bar indicates estimated number of nucleotide substitutions per site. Abbreviations: CT, Connecticut; HAdV, human adenovirus; IL, Illinois; MD, Maryland; MI, Michigan; MO, Missouri; NC, North Carolina; NJ, New Jersey; NY, New York; OR, Oregon; PA, Pennsylvania; TX, Texas; USA, United States; VA, Virginia; WI, Wisconsin.

