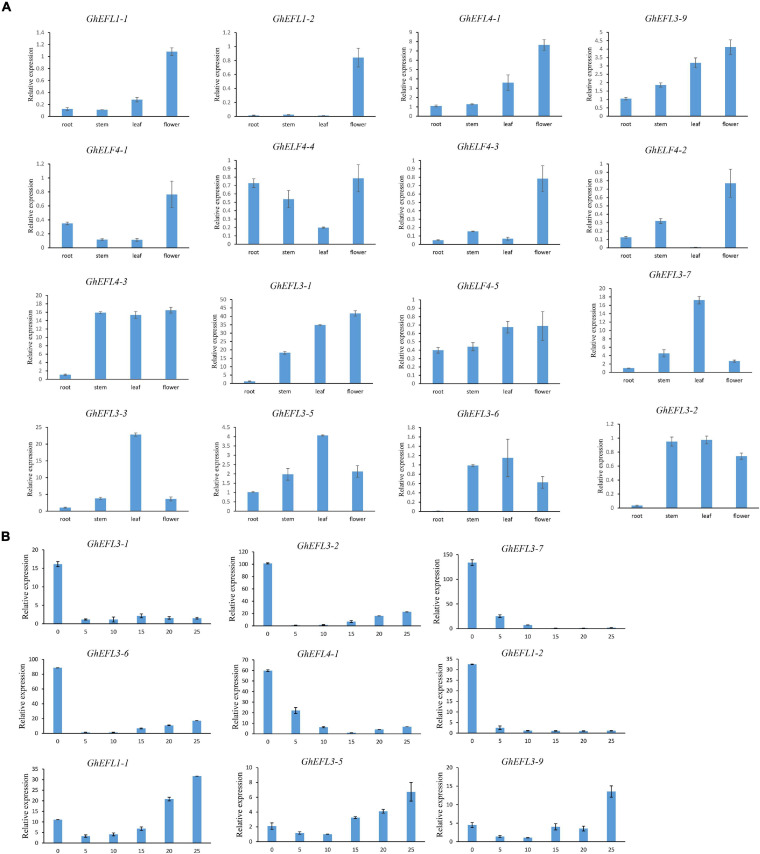
FIGURE 7.
Relative expression levels of GhELF4s in different tissues. (A) Expression analysis of GhELF4 in roots, stems, leaves and flowers. (B) Expression analysis of GhELF4s in fiber developmental stages. 0, 5, 10, 15, 20, and 25 represent 0, 5, 10, 15, 20, and 25 DPA fibers. Error bars showed the standard deviation of three biological replicates.

