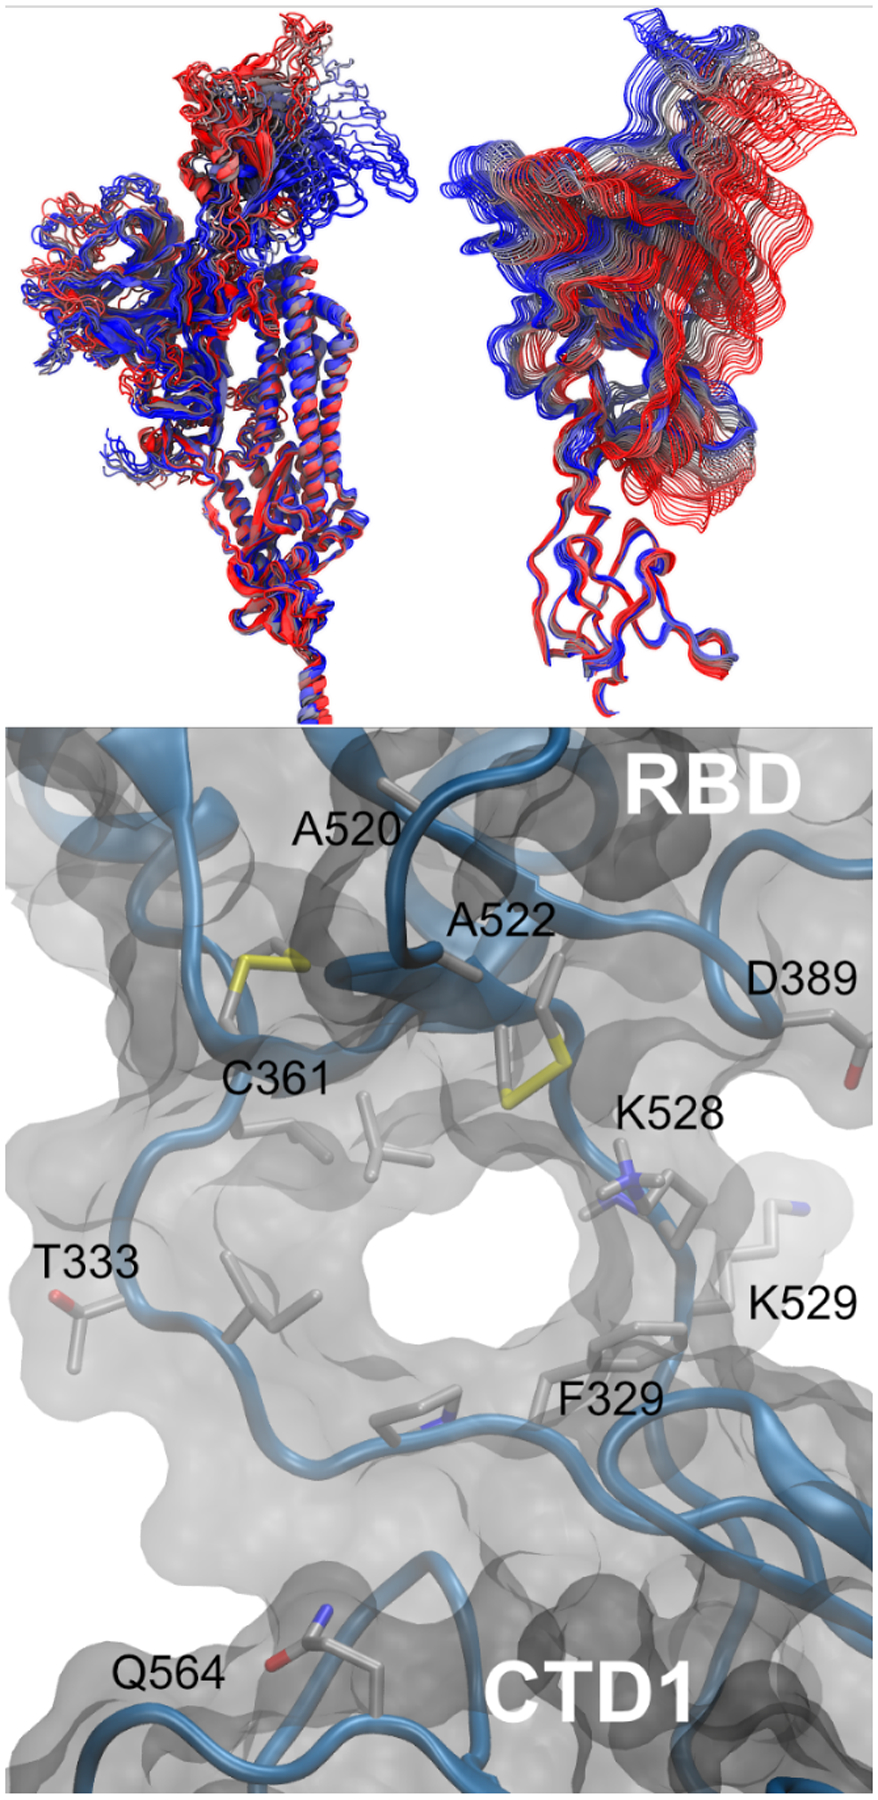
Figure 6.

Spike structure data from the RBD opening pathway. (Top, A) structures of a single protomer colored by opening pathway progress from blue to red, with the entire protomer shown on the left (best-fit to central helices to emphasize the larger change in RBD as compared to CTD1 domain) and close-up of the pocket formed between the RBD and CTD1 shown on the right (best-fit to CTD1 to emphasize the hinge motion between these domains). (Bottom, B) hinge pocket and tunnel in simulated open RBD structure, viewed from inside the spike. Sidechains discussed in the text are labeled. For clarity, the solvent, most sidechains and hydrogen atoms are not shown.
