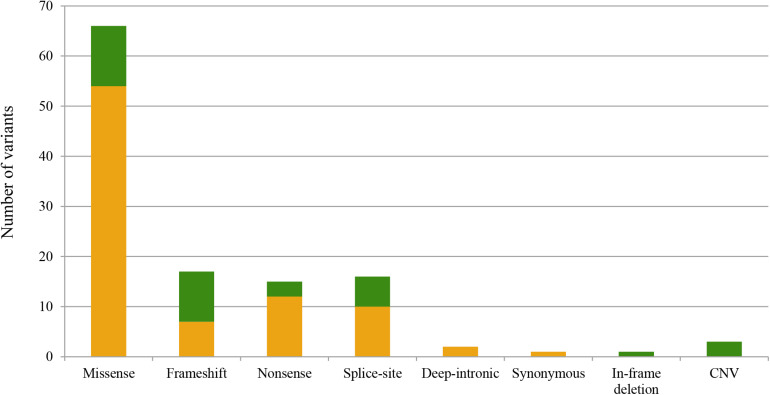
FIGURE 1.
Representation of the total alleles identified in this study classified according to the alteration type. The X-axis refers to the different types of variants identified in this study, and the Y-axis concerns the total allele count for each type of variant. Pathogenic variants identified in this study are represented in green, while those previously described are in orange.

