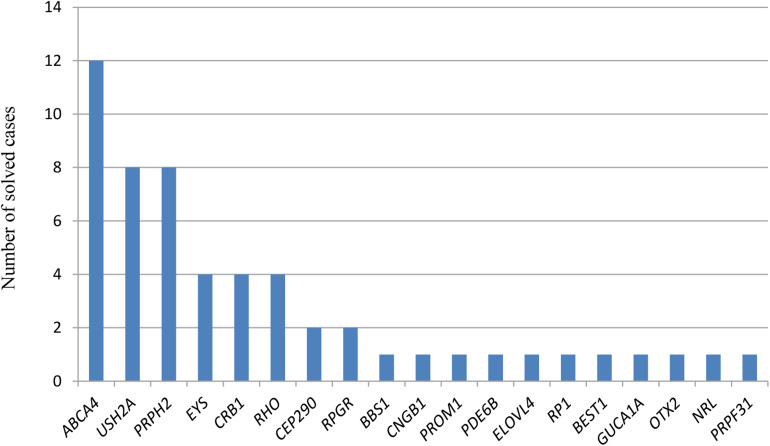
FIGURE 2.
Number of solved cases with mutations in the different disease-causing genes. The X-axis refers to the responsible genes for each solved case, and the Y-axis to the number of solved cases for each disease-causing gene. Only genes responsible for the disease are represented. For patient RPN-670 (FRPN-265), the three different possible responsible genes for the IRD are represented.

