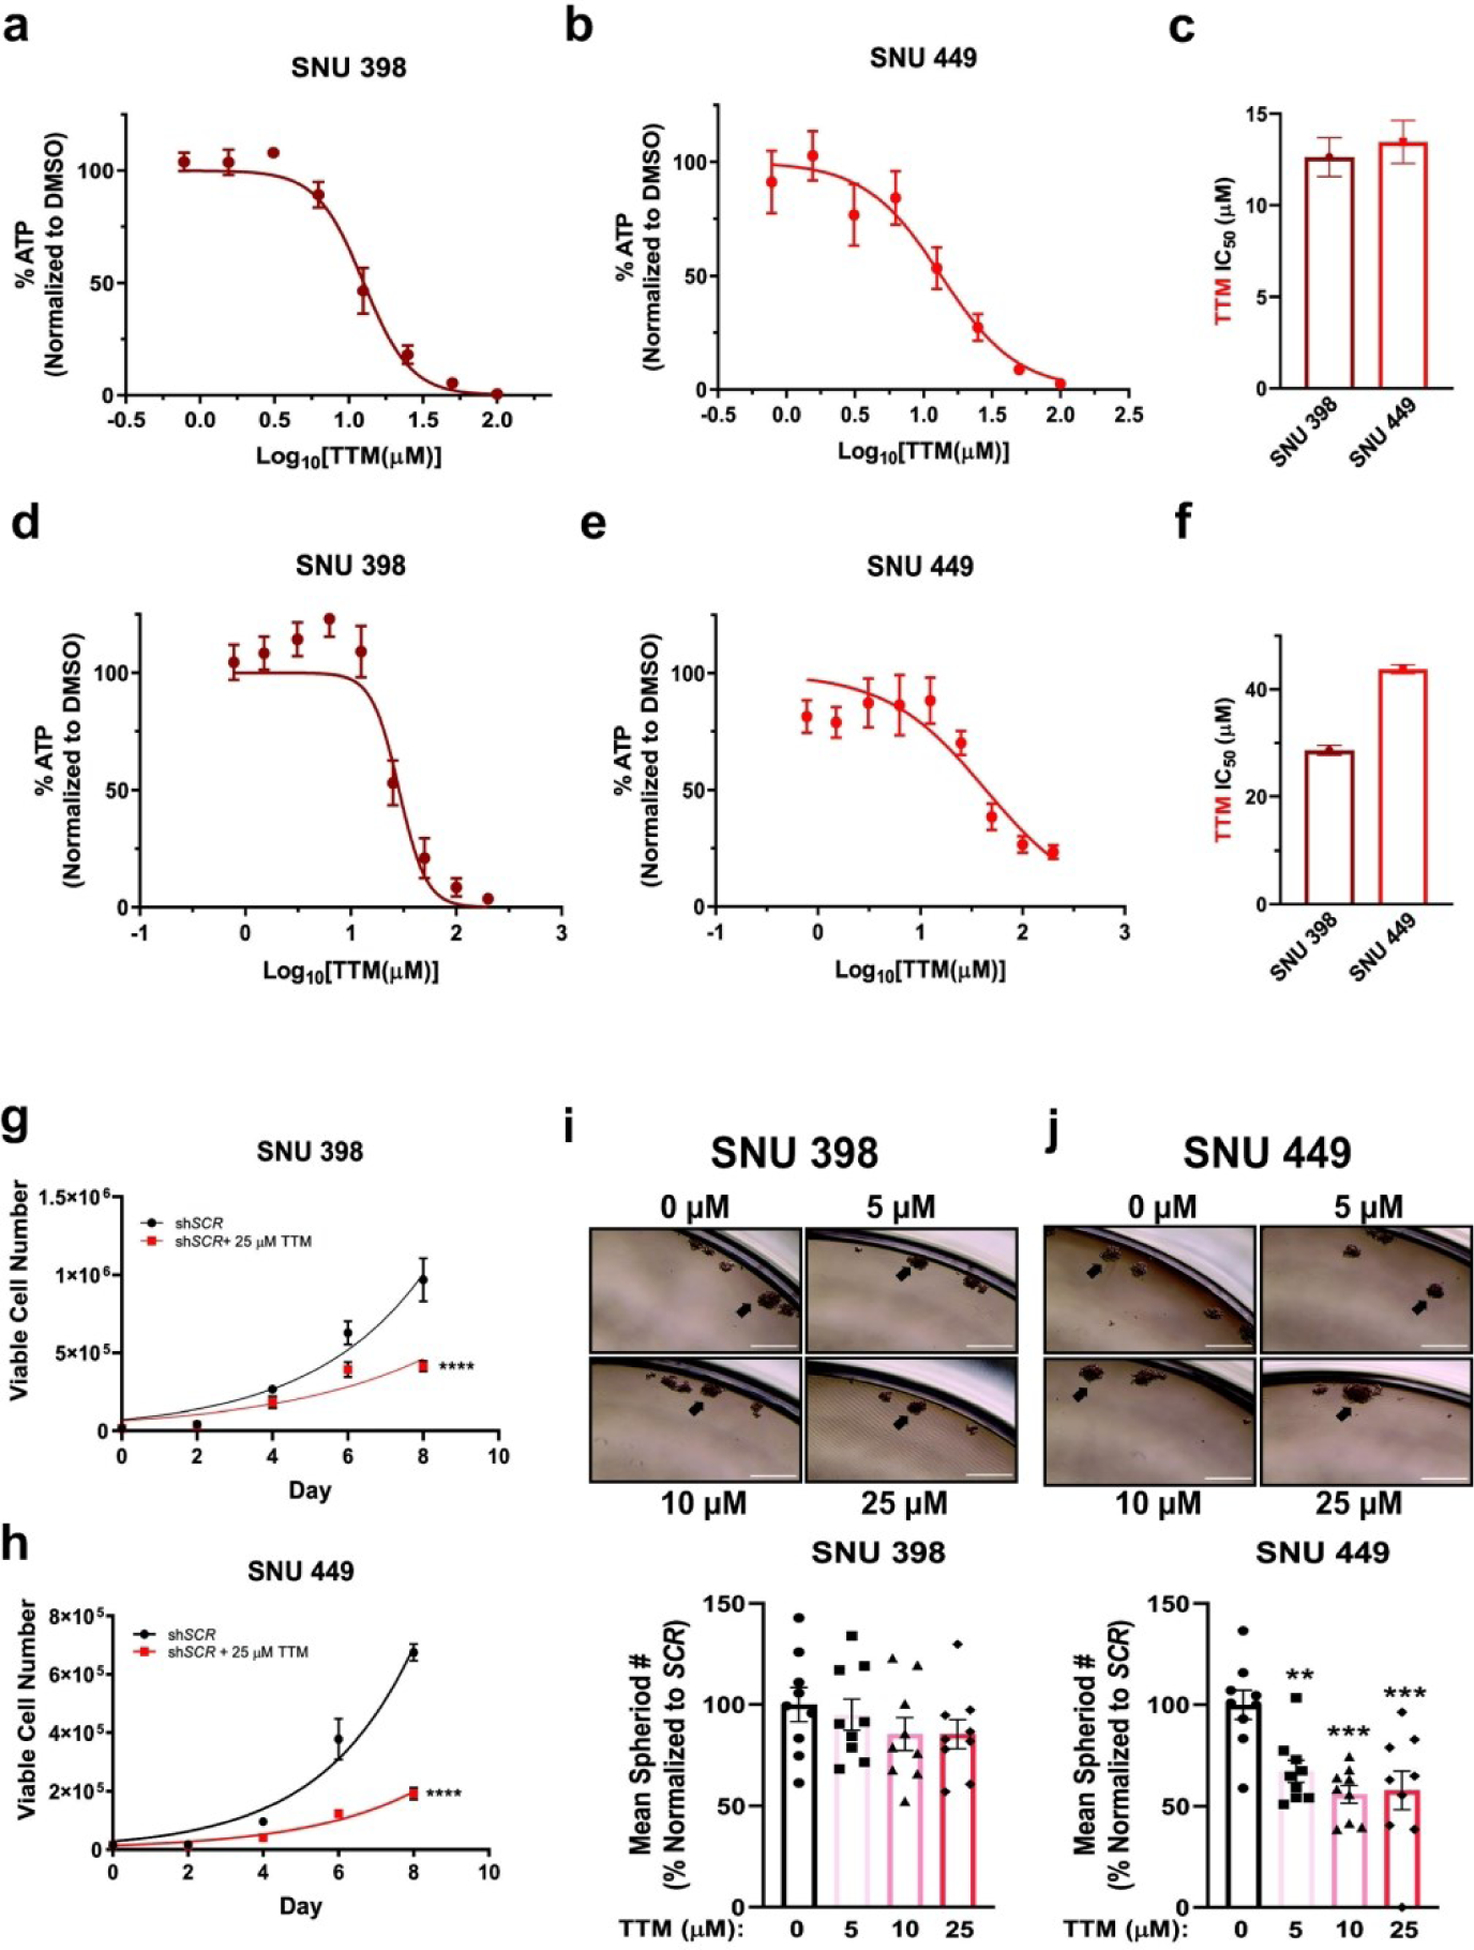
Fig. 3. TTM, a Cu specific chelator, hinders anchorage-dependent and anchorage-independent growth.

(a and b) Relative CellTiter-Glo® cell viability ± s.e.m. of SNU398 (a) or SNU449 (b) HCC cells treated with the indicated concentrations of TTM upon plating in anchorage-dependent (2D) conditions. n = 2 independent biological experiments, with each experiment plated in technical triplicate. (c) Bar graph of TTM IC50 values from (a) and (b) ± s.e.m. (d and e) Relative CellTiter-Glo 3D® cell viability ± s.e.m. of SNU398 (d) or SNU449 (e) HCC cells treated with the indicated concentrations of TTM upon seeding into ultra-low attachment (3D) plates. n = 3 independent biological experiments, with each experiment plated in technical triplicate. (f) Bar graph of TTM IC50 values from (d) and (e) + s.e.m. (g and h) Non-linear fit to the exponential growth equation of cellular proliferation from SNU398 (g) and SNU449 (h) cell lines, seeded side-by-side with cells in Fig. 2c and 2d, except treated with 25 μM TTM. n = 3 independent biological experiments, with each experiment plated in technical triplicate. Statistical analysis was performed using a two-way ANOVA followed by Dunnett’s multiple comparison test. ****P < 0.0001. (i and j) Representative images of anchorage-independent growth in ultra-low attachment plates in SNU398 (i, top) or SNU449 (j, top) cell lines treated with the indicated concentration of TTM, with the normalized mean number of spheroids per field of view represented as a scatter dot plot for SNU398 (i, bottom) and SNU449 (j, bottom) from n = 9 fields of view per condition from three independent biological experiments. Data was analyzed using a one-way ANOVA followed by Dunnett’s multiple comparison test *P < 0.0332, **P < 0.0021, ***P < 0.0002, ****P < 0.0001. 10x magnification, scale bar = 400 μm.
