
FIG 2.
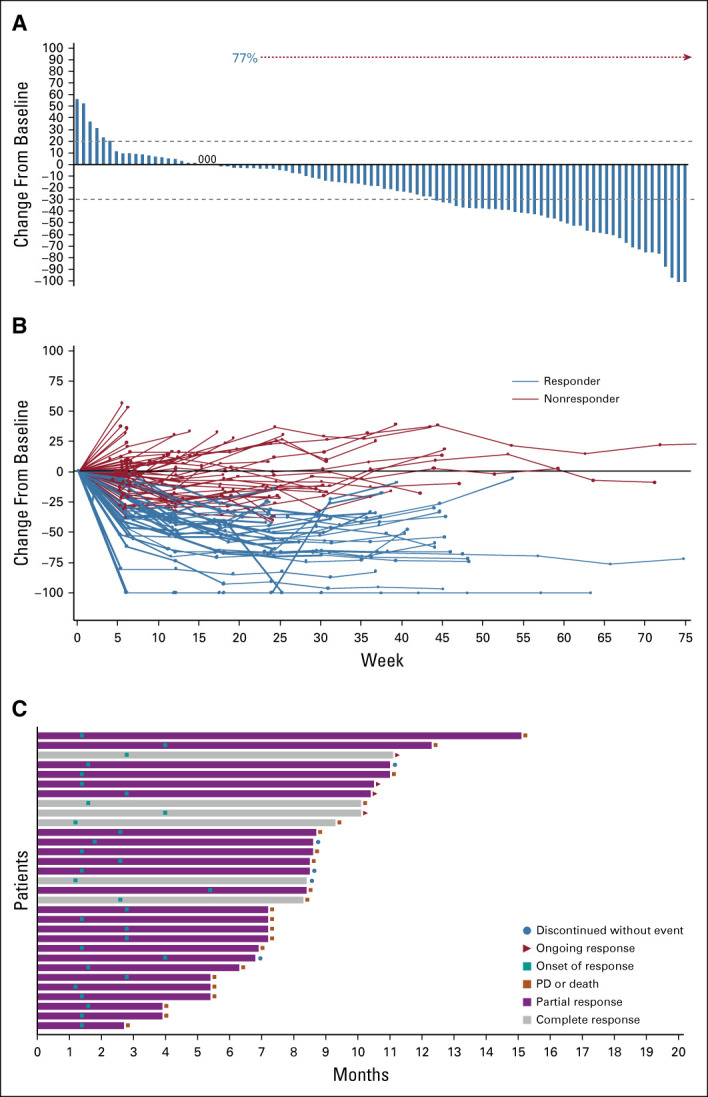
Tumor response to sacituzumab govitecan. (A) Waterfall plot showing best percent change from baseline in the sum of the diameters of the target lesions (longest for non-nodal and short axis for nodal lesions) in 94 patients (excludes 19 patients; 15 patients did not have post-baseline radiologic assessments and four patients lacked or had unevaluable target lesions at baseline or post-baseline). The dashed lines at +20% and −30% indicate thresholds for PD and partial response, respectively, according to RECIST v1.1. Target lesions were reduced in 77% of patients (72 of 94) with at least 1 post-baseline target lesion measurement. (B) Spider plot of tumor response by week. (C) Swimmer plot of response and duration. PD, progressive disease.