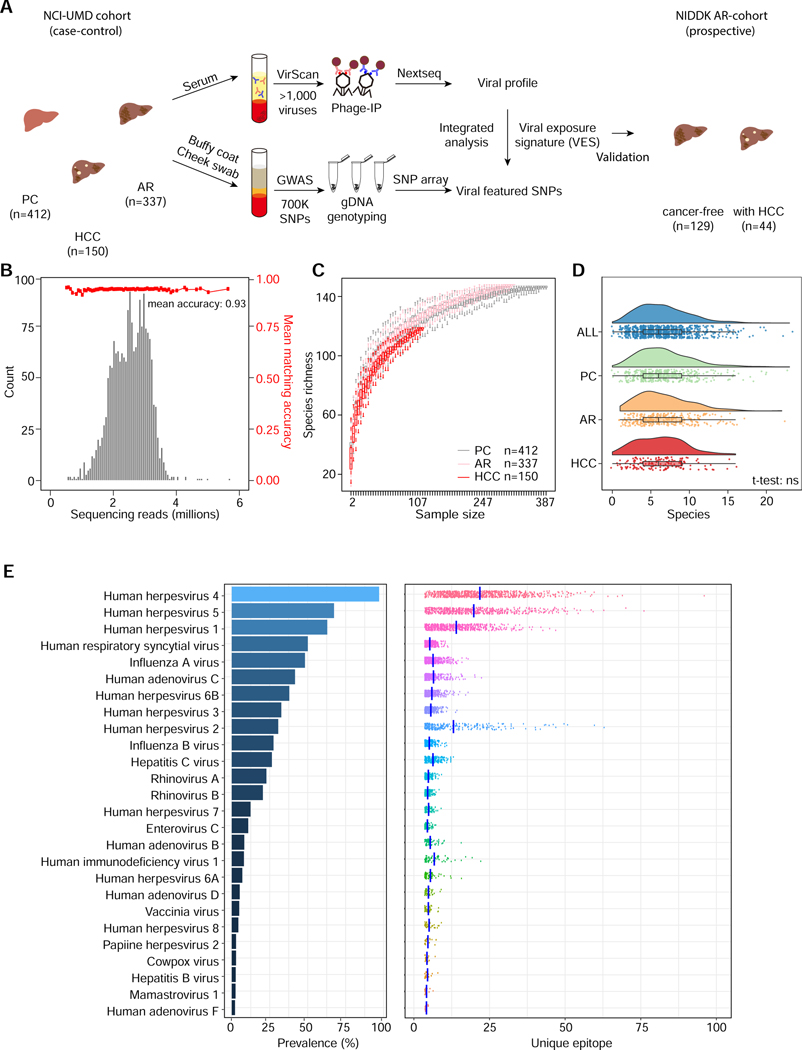
Figure 1. Assessment of Viral Infection History in a Case-control and a Prospective Cohort Using VirScan.
(A) Schema of screening of a NCI-UMD cohort consisting of 899 serum samples (analyzed by VirScan) and 849 matching buffy coat or cheek swab samples (analyzed by GWAS) with integrated analysis across population groups, namely population controls (PC, n=412), at-risk chronic liver disease cases (AR, n=337) and hepatocellular carcinoma cases (HCC, n=150); the resulting viral exposure signatures (VES) were validated in a prospective NIDDK cohort with cancer-free (n=129) and HCC (n=44) patients. (B) Sequencing read statistics of VirScan with mean matching accuracy of 0.93. (C) Rarefaction plot showing the viral species richness detected in PC, AR and HCC groups. (D) Raincloud plot showing the number of viral species in each individual across populations. (E) Left panel: viral infection prevalence across all samples. Right panel: number of unique epitopes per sample; vertical bars represent mean values.

