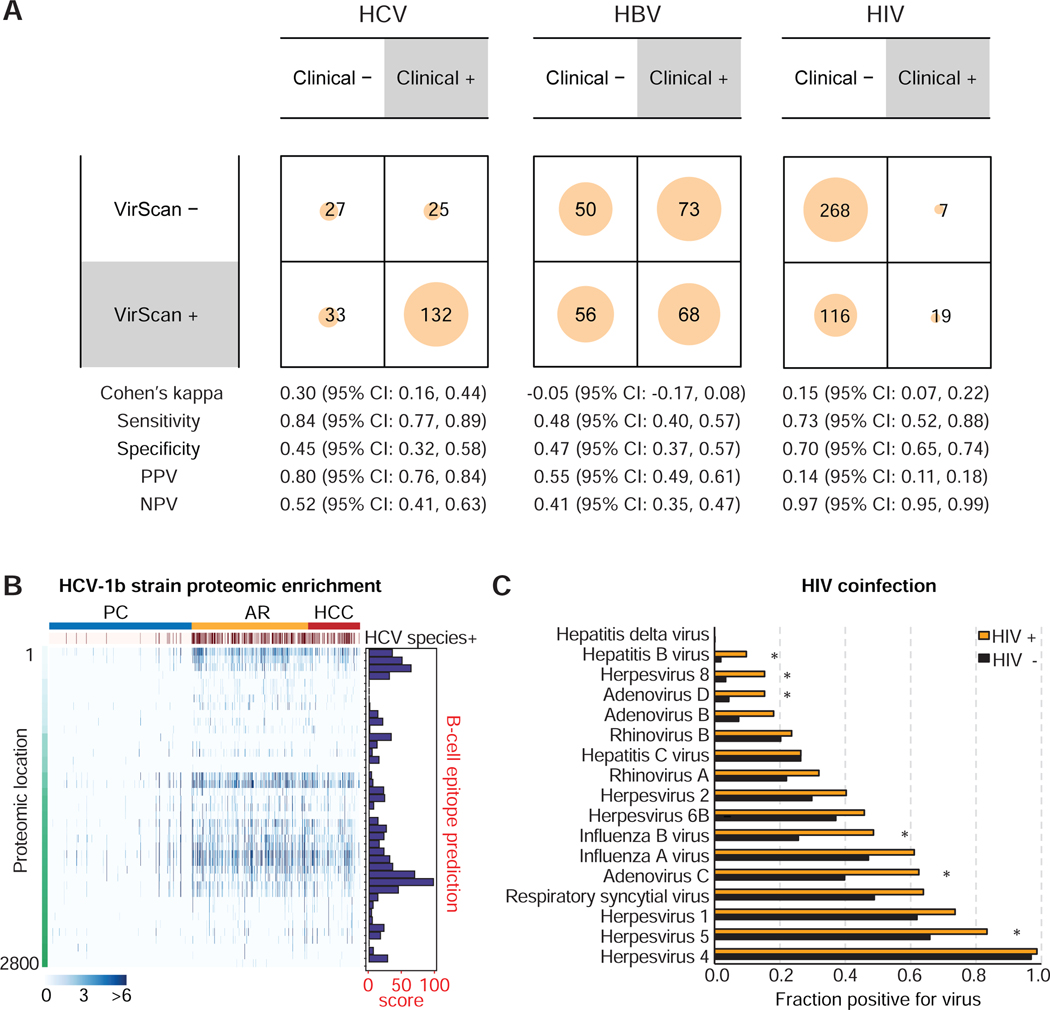
Figure 2. Comparison of VirScan with Medical Charts, Antigenicity of HCV1b and HIV Coinfection Viruses.
(A) Contingency matrices comparing HCV, HBV and HIV detection with VirScan against viral detection laboratory tests reported in the patient medical charts. For the purpose of computing binary classification test statistics, clinical results were considered true values and VirScan results were considered predicted values. (B) Left panel: Heatmap showing HCV proteomic enrichment among PC, AR and HCC groups. Each row represents the significant peptide tiling. Each column is a sample. The proteomic location of the tiling peptides is annotated with a vertical bar on the left. The top-most horizontal annotation bar indicates patients grouped as PC, AR and HCC, as indicated. Second from the top, the annotation bar indicates positive HCV species based on VirScan data. The color intensity of each cell corresponds to the scaled - log10(p-value) measure of significance of enrichment for a peptide in a sample (where greater values indicate stronger antibody response). Right panel: B-cell epitope prediction score for each peptide. (C) Coinfection viral status in HIV positive versus HIV negative cases. Asterisks denote false discovery rate FDR < 0.05.

