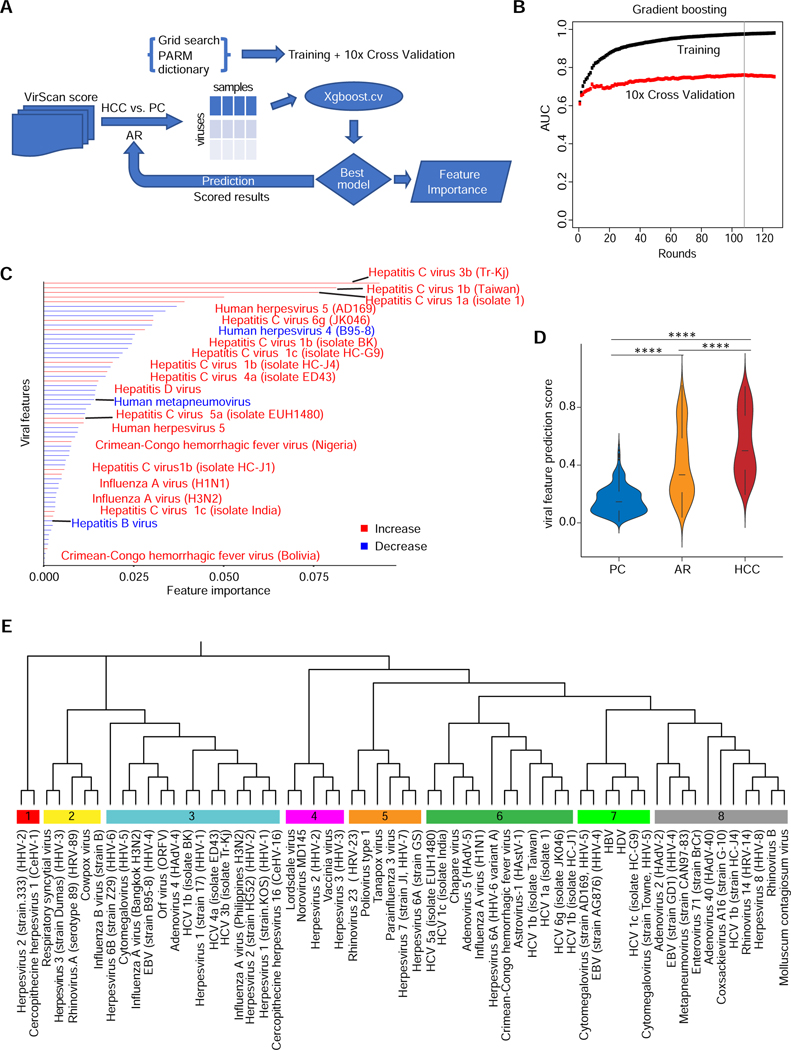
Figure 3. Extraction of Predictive VES Signatures Associated with HCC.
(A) VES are identified using the Xgboost machine learning algorithm. The flow chart shows the procedure to compare HCC versus PC viral profiles in training and cross validation sets. The resulting model provides scored results leading to a predictive VES score for each individual in the PC, AR and HCC groups. (B) Gradient boosting plot showing the area under the curve (AUC) value of training and cross validation sets. Gradient boosting stops at round 108 (vertical line) to avoid overfitting. (C) Bar plot showing the VES identified by comparing HCC with PC using Xgboost in the NCI-UMD cohort. Red bars denote an increase of viral infections in HCC versus PC, whereas blue bars represent a decrease. (D) Predictive VES score among PC, AR and HCC groups (**** two-tailed Mann-Whitney test p-value < 0.0001). (E) Phylogenetic analysis of the 61 viral strains, which results in 8 well-defined branches.

