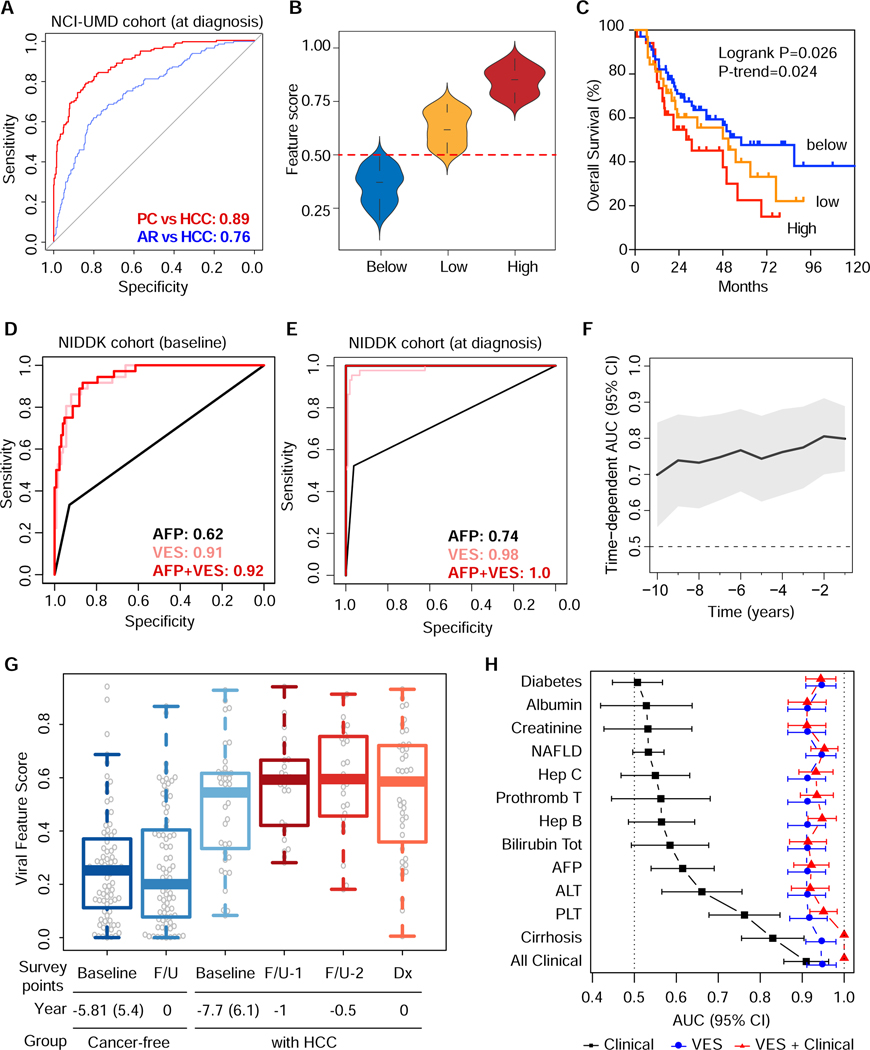
Figure 5. Assessment of VES Signatures: Predictive Performance and Association with Clinical Outcomes.
(A) Receiver operating characteristic (ROC) curves for the NCI-UMD cohort at HCC diagnosis. Area under the curve (AUC) values are shown for PC vs HCC prediction, as well as for AR vs HCC prediction, as indicated. (B) Feature score distributions of NCI-UMD subcohorts grouped by VES level, which were classified as below (threshold=0.50, dashed line), low and high. Low and high VES levels are separated by the median among patients with VES above the threshold. (C) Kaplan-Meier survival plots for NCI-UMD subcohorts grouped by VES level. (D, E) ROC curves for the NIDDK validation cohort at HCC baseline and diagnosis, respectively. AUC values are shown for alpha-fetoprotein (AFP), VES, and the combination of both. (F) Time-dependent AUC showing the landmark timepoints performance of VES from 1 to 10 years relative to baseline. (G) Baseline and follow-up viral feature scores of the NIDDK cancer-free group compared with those of high-risk patients that ultimately developed HCC. (H) AUC values corresponding to predictions based on clinical indicators from patient charts compared with those based on VES, as well as those based on the combination clinical and VES for the NIDDK cohort at baseline.

