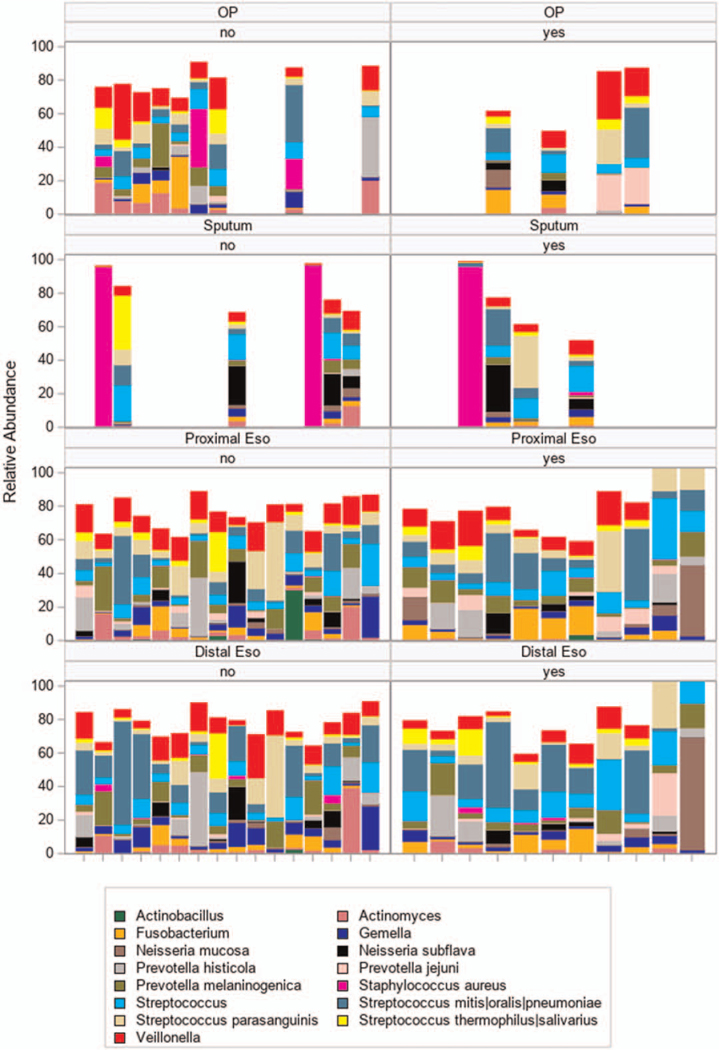
FIGURE 2.
Esophageal and lung taxa across groups. The y-axis in the left-hand panels show relative abundance of taxa in the samples collected off acid blockade (n = 14) whereas the panels on the right show relative abundance in those on acid blockade (n = 13, 13 samples from 11 individuals on acid blockade). Horizontal panels from top to bottom are clustered by site from top to bottom: oropharyngeal swab (OP), sputum, proximal esophagus (proximal eso), and distal esophageal (distal eso) specimens. Each unique vertical bar graph indicates taxa detected in an individual sample grouped by location. Each taxon is indicated in a different color. The height of the bar corresponds to the relative abundance. Samples from each individual are aligned along the x-axis between anatomical sites. Empty spaces indicate no specimen from the indicated site for that individual. No = individual off acid blockade; yes = individual on acid blockade.

