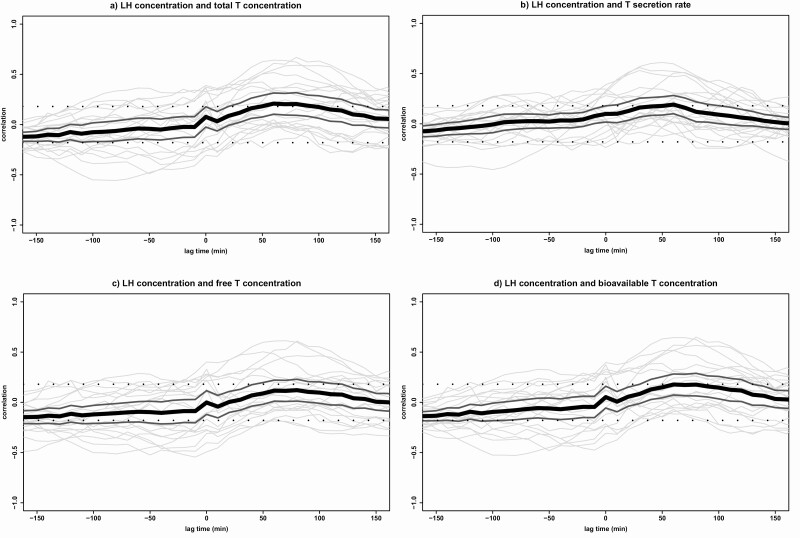
Figure 3.
Cross-correlations between LH and T. Cross-correlations between LH concentrations and (A) total T concentrations, (B) T secretion rates, (C) free T concentrations, and (D) bioavailable T concentrations in all 20 participants. Cross-correlation assesses the relative strength between 2 hormone time series for all possible time shifts. The graph displays the correlation (y-axis) at a lag time in minutes (x-axis) with each gray line corresponding with 1 participant. The black line indicates the mean correlation for all participants and the 2 dark gray lines indicate the 95% CI. The significance level is indicated by 2 straight dotted lines at correlations –0.18 and +0.18. Negative lag times represent a correlation in which hormone 2 is followed by hormone 1 and positive lag times represent a correlation in which hormone 1 is followed by hormone 2. T, testosterone.

