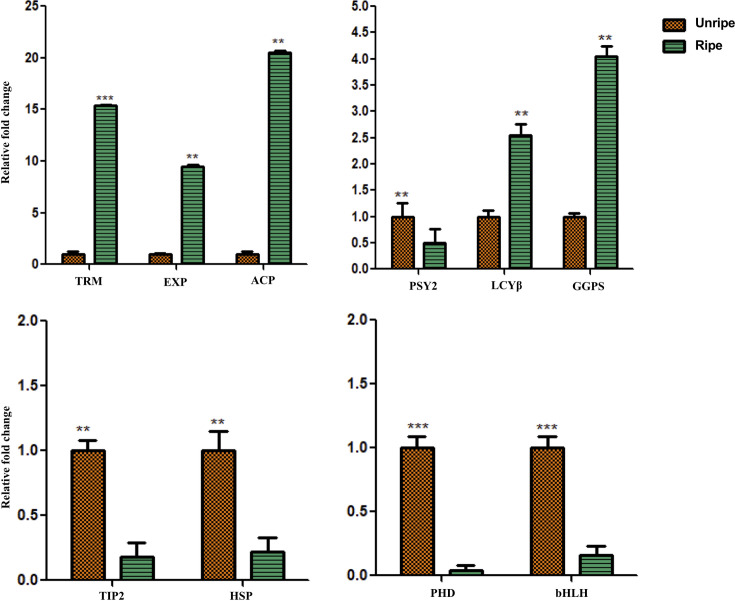
Fig 6. Quantitative real-time PCR of selected genes.
Expression profile of selected genes in ripe Nendran banana. Gene expression was normalized using Actin1 as an internal control. Orange bars represent the expression of unripe while green bars depict the expression of ripe genes. Statistical analysis was executed using Student’s paired t-test and statistical significance was checked at **P ≤ 0.001; ***P ≤ 0.0001. TRM (Trans-resveratrol di-O-methyltransferase); EXP (Expansin-A2); ACP (Putative 3-oxoacyl-[acyl-carrier-protein] reductase, chloroplastic); PSY2 (phytoene synthase 2); LCYβ (lycopene beta cyclase); GGPS (geranylgeranyl pyrophosphate synthase); TIP2 (Probable aquaporin TIP2); HSP (Heat shock 70 kDa protein 8); PHD (PHD-type domain-containing protein); bHLH (transcription factor bHLH62).(Corresponding gene IDs given in S1 Table).

