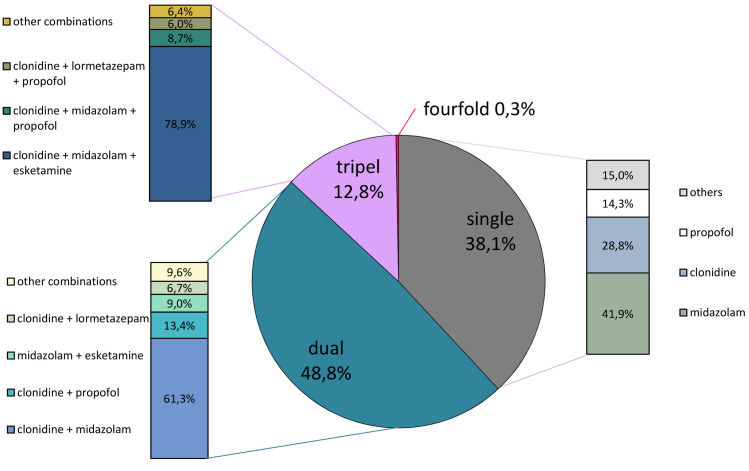
Fig 2. Single and multiple sedation in COVID-19 patients.
The pie chart represents the types and frequency of single or multiple sedation in percentage. The associated bar charts represent the subdivision of the applied sedatives and their combinations in percentage. *other combinations: sum of conceivable otherwise twofold or threefold combined sedative applications.

