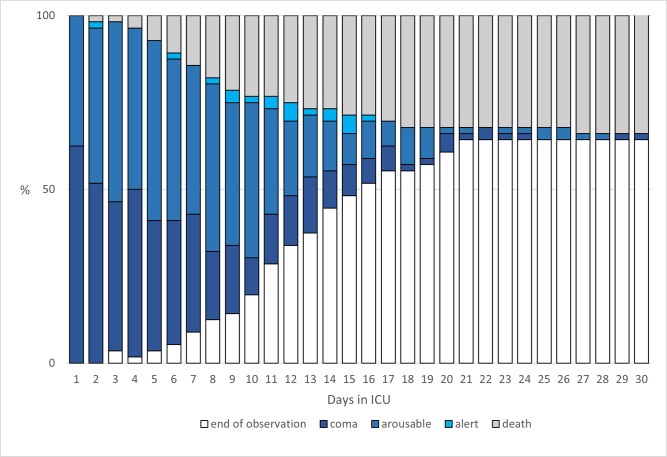
Fig 4. Cumulative frequency of observed sedation depth.
Graphical plot of the cumulative frequency of observed sedation depth and death in patients with moderate or severe COVID-19-related acute respiratory distress syndrome (ARDS) requiring mechanical ventilation. Sedation depth measured by Richmond Agitation Sedation Score (RASS) is graphically represented by coma (dark blue, RASS ≤ -3), arousable (blue, RASS = -2), or alert (light blue, RASS ≥ -1). Furthermore, leaving the observation period by death (in gray) or tracheostomy or extubation (white) is graphically represented.

