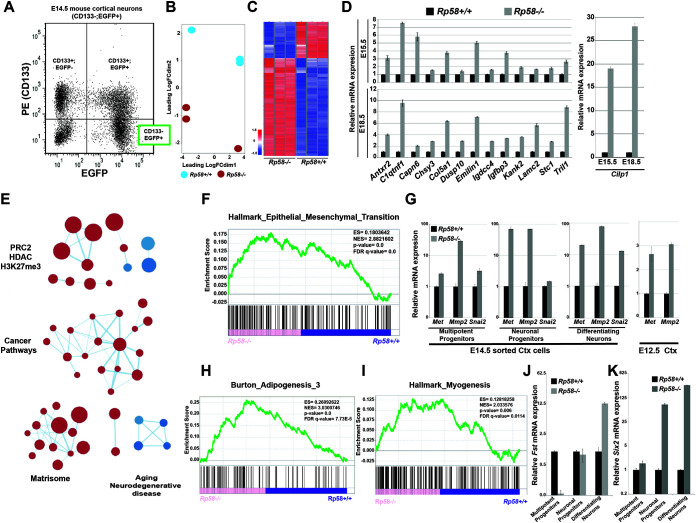
FIG 1.
RP58 represses nonneuronal programs during normal neuronal differentiation. (A) Fluorescence-activated cell sorting (FACS) graph showing separation of E14.5 cortical cells based on CD133 expression and enhanced green fluorescent protein (EGFP) (driven from the tbr2 regulatory region). The subpopulations of sorted cells include the following: CD133+/EGFP−, composed of radial glial cells (RGCs) in the ventricular zone (VZ); double positives, composed of intermediate neuronal progenitors in the subventricular zone (SVZ); and CD133−/EGFP+, composed of differentiating/differentiated cortical neurons which were subjected to transcriptome sequencing (RNA-seq). (B) Principal-component analysis (PCA) of RNA expression in RNA-seq data from E14.5 sorted Rp58−/− versus Rp58+/+ differentiating neurons (n = 3 biological replicates for each genotype). FC, fold change. (C) Heatmap of the expression of genes regulated in the Rp58−/− versus Rp58+/+ embryonic neurons. (D) Analyses of the expression levels of RP58 target genes in Rp58+/+ and Rp58−/− cortices at E15.5 and E18.5. (E) Enrichment map of MSigDB C2 gene sets enriched (false-discovery rate [FDR] < 0.05) in Rp58−/− versus Rp58+/+ expression signature. (F) Gene set enrichment analysis (GSEA) revealing that the genes that are derepressed in the Rp58−/− neurons show a significant similarity with genes associated with the epithelial-mesenchymal transition (EMT). ES, enrichment score. NES, normalized enrichment score. (G) Analyses of the expression levels of the Met, Mmp2, and Snai2 genes in the E14.5 sorted cortical cells and in the E12.5 cerebral cortex of Rp58−/− and Rp58+/+ embryos. (H and I) GSEA analysis showing the significant correlation of the genes upregulated in the Rp58−/− with those genes associated with myogenesis or adipogenesis. (J and K) Analyses of the expression levels of Fst (J) and Six2 (K) mRNA in E14.5 sorted cortical cells.

