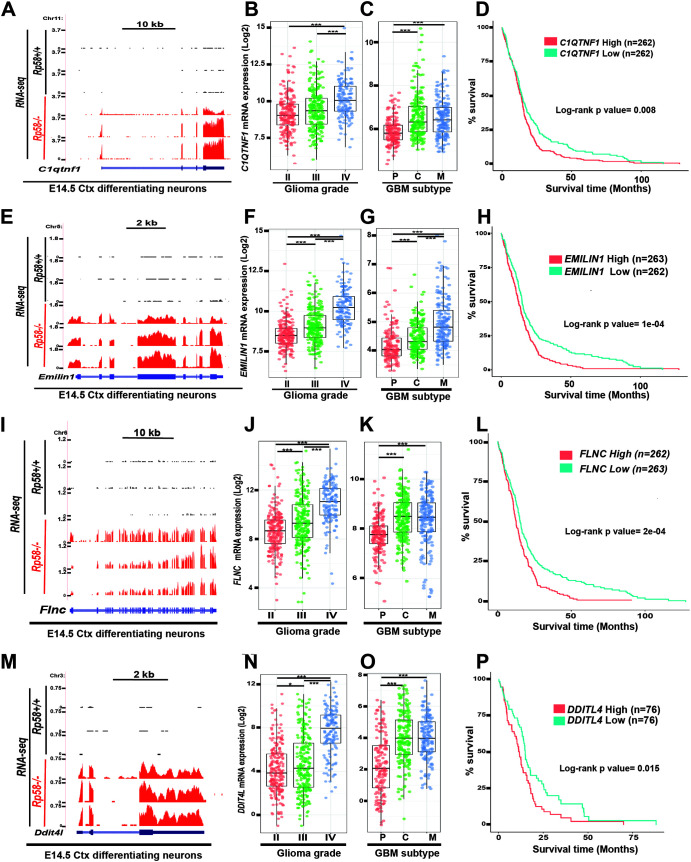
FIG 4.
Expression of RP58 developmental target genes is correlated to glioma progression, mesenchymal subtype acquisition, and prognosis. (A, E, I, M) RNA-seq data of sorted E14.5 cortical neurons (Ctx) from E14.5 Rp58+/+ (n = 3) and Rp58−/− (n = 3) were visualized on the UCSC genome browser as wiggle tracks. The wiggle tracks in black show the minimal expression of C1qtnf1 (A), Emilin1 (E), Flnc (I), and Dtti4l (M) in Rp58+/+ neurons, while the red tracks indicate their significant expression in the Rp58−/− neurons. Exon and intron structures of the C1qtnf1 (A), Igfbp3 (E), Flnc (I), and Dtti4l (M) genes are shown. (B, F, J, N) Box plots showing the normalized expression of C1QTNF1 (B), EMILIN1 (F), FLNC (J), and DDTI4L (N) genes in human glioma samples according to tumor grade and following analysis of the RNA expression results from TCGA GBM-LGG samples using GlioVis (n = 226 grade II, n = 244 grade III, and n = 150 grade IV or GBMs). (C, G, K, O) Box plots showing the normalized expression of C1QTNF1 (C), EMILIN1 (G), FLNC (K), and DDTI4L (O) genes in GBM samples according to tumor subtype and following analysis of the RNA expression results from GBM TCGA samples using GlioVis (n = 163 subtype P [proneural], n = 199 subtype C [classical], and n = 166 subtype M [mesenchymal] for panels C, G, and K; n = 151 subtype P, n = 182 subtype C, and n = 156 subtype M for panel O). (B, C, F, G, J, K, N, O) ***, P < 0.001; *, P < 0.05. (D, H, L, P) Kaplan-Meier survival curves of TCGA GBM patients using GlioVis showing that high levels of C1QTNF1, EMILIN1, FLNC, and DDTI4L expression correlate with worse overall survival (P value calculated using the log rank test; high versus low expression for each gene). Number of samples used in each analysis is indicated for each gene.

