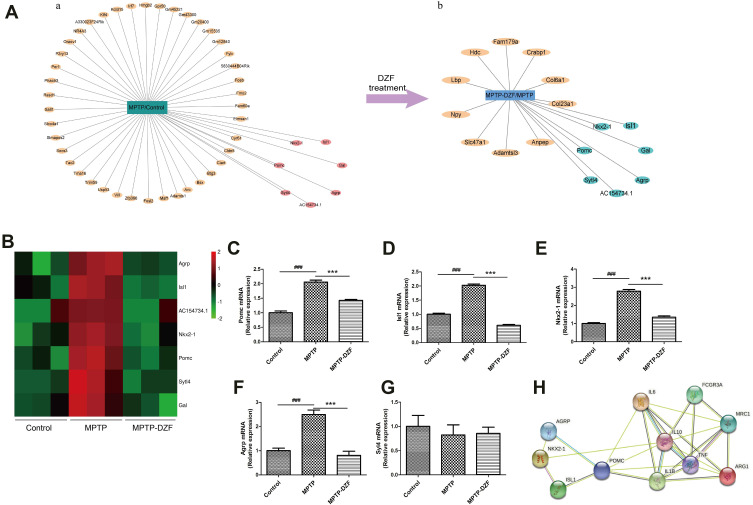
Figure 7.
POMC gene is key target associated with the DZF to treat PD. (A) The oppositely regulated genes in the MPTP group compared with Control group and the MPTP group compared with the MPTP-DZF group. ((A)a represent differential genes between MPTP and Control groups. (A)b represent differential genes between MPTP-DZF and MPTP groups. The pink in (A)a and the green in (A)b are the same gene, but the expression trend is opposite). (B) Heatmap show reverse differential genes changed among the Control, Mode, and DZF groups. (C–G) RT-PCR verification of differential genes. (H) Interaction analysis of differentially genes and target effect. Protein–protein interaction was predicted between differentially genes and inflammation-related indicators using STRING database. Colored nodes represent query proteins and first shell of interactors; Edges represent protein-protein associations; The blue and purple lines represent known interactions; The green, red and blue lines represent predicted interactions. Data represent the means ± SEM; Statistics one-way ANOVA; ###P < 0.001 vs Control group; ***P < 0.001, vs MPTP group; n = 3.

