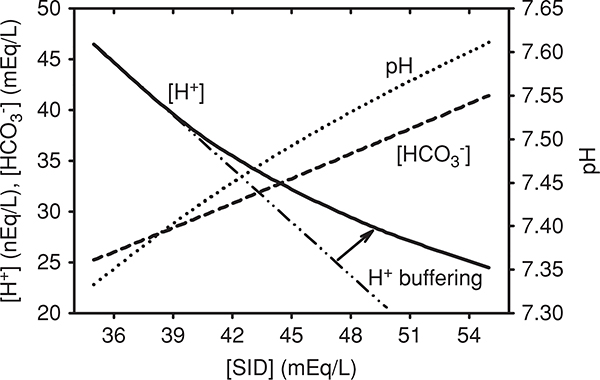
Figure 12.
Relationships showing the dependence of plasma pH, [H+], and [HCO3−] on plasma [SID] when PCO2 is held constant at 40 mmHg and [Atot] is held constant at 16 mEq/L. Note the decreasing slope in the [SID]: [H+] relationship with increasing [SID], indicating increased ability to remove (buffer) H+ from solution. For comparison, the dashed—dotted line extrapolates a linear decrease in [H+] with increasing [SID]; increasing [SID] from 39 to 45 mEq/L has the effect of buffering approximately 3 mEq/L of H+.

