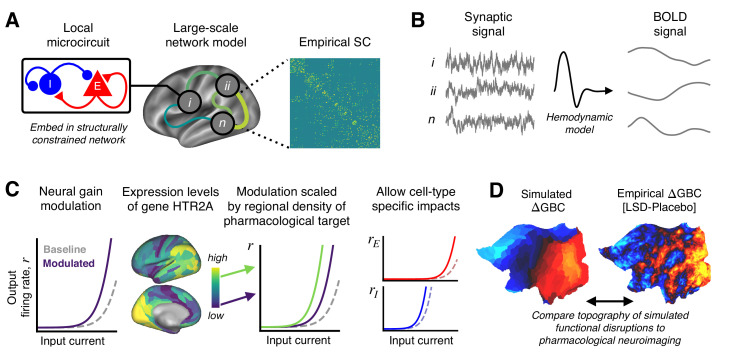
Figure 1. Schematic overview of the biophysical modeling framework.
(A) Each node in the large-scale model represents a cortical microcircuit comprised of recurrently coupled excitatory (E) and inhibitory (I) neuronal populations. The model includes one node for each of the 180 left-hemispheric parcels in the Human Connectome Project’s Multi-Modal Parcellation (MMP1.0). Nodes interact through structured long-range excitatory projections, the strengths of which are constrained by a diffusion magnetic resonance imaging (MRI)-derived structural connectivity (SC) matrix. (B) Simulated synaptic activity in each node is transformed to a simulated blood oxygen level-dependent (BOLD) signal using the Balloon-Windkessel model of the hemodynamic response. (C) Lysergic acid diethylamide (LSD)’s effect on cortical microcircuitry is modeled as a modulation of neural gain due to serotonin-2A (5-HT2A) receptor agonism by the LSD molecule. The degree to which neural gain is modulated within an area is scaled in proportion to the regional expression level of HTR2A, the gene which encodes the 5-HT2A receptor protein. Gain curves of the excitatory and inhibitory neuronal populations are modulated independently, permitting cell-type specific effects. (D) Global brain connectivity (GBC), a graph-theoretic functional measure, is dramatically altered following LSD administration. The functional MRI (fMRI)-derived map of the change in GBC (ΔGBC) under LSD, relative to placebo, specifies the target model output. To simulate brain function in the LSD and placebo drug conditions, we simulate GBC maps with and without gain modulation, respectively. We compute the difference between the model GBC maps to construct a simulated ΔGBC map. Quantitative comparisons between empirical and model ΔGBC maps determine how well the model captures the topography of LSD-induced functional disruptions.


