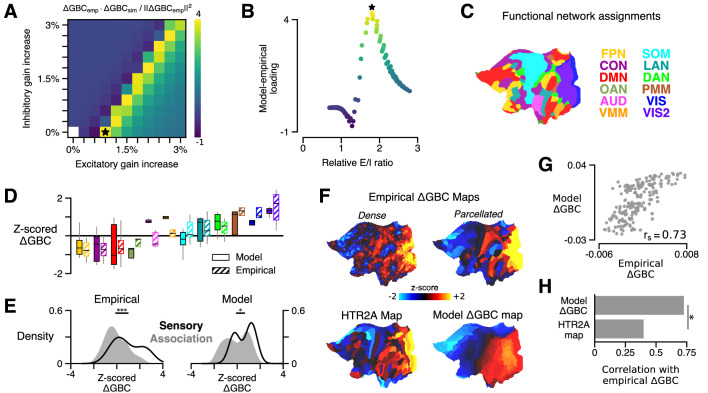
Figure 2. HTR2A-mediated excitatory gain modulation captures effects of lysergic acid diethylamide (LSD) on human cortical global brain connectivity (GBC) topography.
(A) Two-dimensional grid search over the two free model parameters. Parameters govern the gain modulation of inhibitory and excitatory neuronal populations in the model. Model-empirical loading – the quantity shown in the heatmap – is defined as the dot product between the empirical change in GBC (ΔGBC) map and a model ΔGBC map, normalized by the squared norm of the empirical ΔGBC map. Loading is maximized for the combination of parameters indicated by the black star. (B) At each point on the grid (i.e., for each combination of gain-modulatory parameters), we computed the excitatory-to-inhibitory (E/I) firing rate ratio, expressed in terms of its unperturbed value. This amounts to computing , where is the E/I ratio in the model with gain modulation, and denotes the E/I ratio in the model without gain modulation. E/I ratio is defined in the model as the ratio of the mean excitatory firing rate (computed across nodes) to the mean inhibitory firing rate. (C) Functional network assignments for each cortical parcel are determined by the Cole-Anticevic Brain Network Parcellation (CAB-NP): ventral multi-modal (VMM), language (LAN), dorsal attention (DAN), posterior multi-modal (PMM), primary visual (VIS), secondary visual (VIS2), frontoparietal (FPN), cingulo-opercular (CON), default mode (DMN), orbito-affective (OAN), auditory (AUD), and somatomotor (SOM) networks. Network colors mirror (Ji et al., 2019). (D) Functional network-level comparisons between simulated (solid) and empirical (striped) z-scored ΔGBC map values. Box plots mark the median and inner quartile ranges for parcels in each network, and whiskers indicate the 95% confidence interval. (E) Distributions of z-scored ΔGBC map values across cortical parcels in primary sensory networks (AUD, VIS, VIS2, SOM; black line with no fill) and association networks (gray fill with no line). Endpoints of the horizontal black lines (top) correspond to the distributions’ means. Distributions significantly differ empirically (p < 10−4; spatial autocorrelation-preserving surrogate map test) and in the model (p = 0.02; spatial autocorrelation-preserving surrogate map test). (F) Spatial topographies of the dense and parcellated empirical ΔGBC maps; the strongest-loading model ΔGBC map; and the HTR2A gene expression map. Maps are portrayed on flattened (unfolded) representations of the cortical surface. (G) Scatter plot illustrating the parcel-wise relationship between the strongest-loading model ΔGBC map and the empirical ΔGBC map. (H) Spearman rank correlations between the empirical ΔGBC map and: (i) the strongest-loading model ΔGBC map; and (ii) the HTR2A expression map. Empirical ΔGBC topography is better explained by the dynamical model than by the HTR2A map (p < 0.05; test for dependent correlations).


