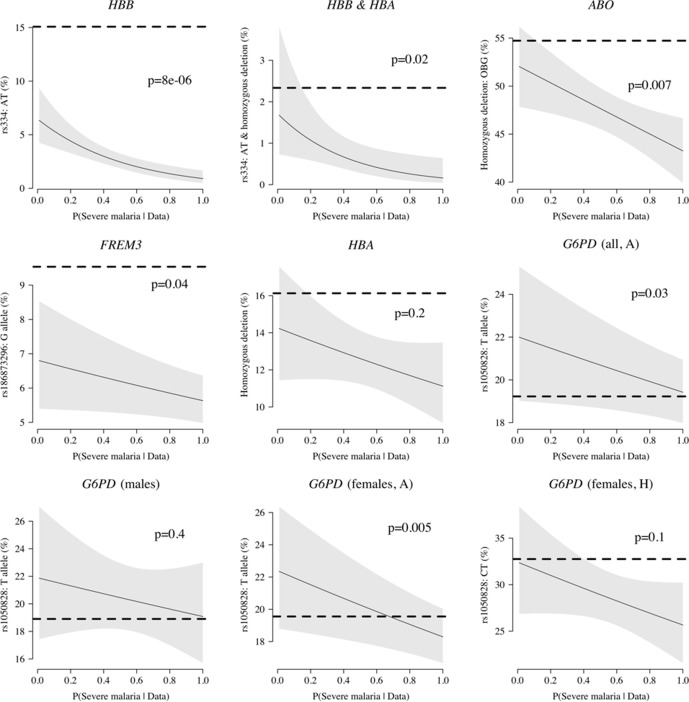
Appendix 5—figure 1. Case-only analysis of five key polymorphisms effecting red cells, reported in Ndila et al., 2020 under additive, recessive or heterozygote models.
The horizontal dashed lines show the estimated frequency in the controls (for additive models, this is the frequency of the derived allele; for the heterozygote or recessive models, this is the frequency of the genotype thought to confer protection). The line (shaded area) shows logistic regression fits with P(Severe malaria | Data) as the predictor (95% confidence interval of the fit). The p-value corresponds to the test that the predictor P(Severe malaria | Data) is not associated with the genotype in the cases only. OBG: O blood group.

