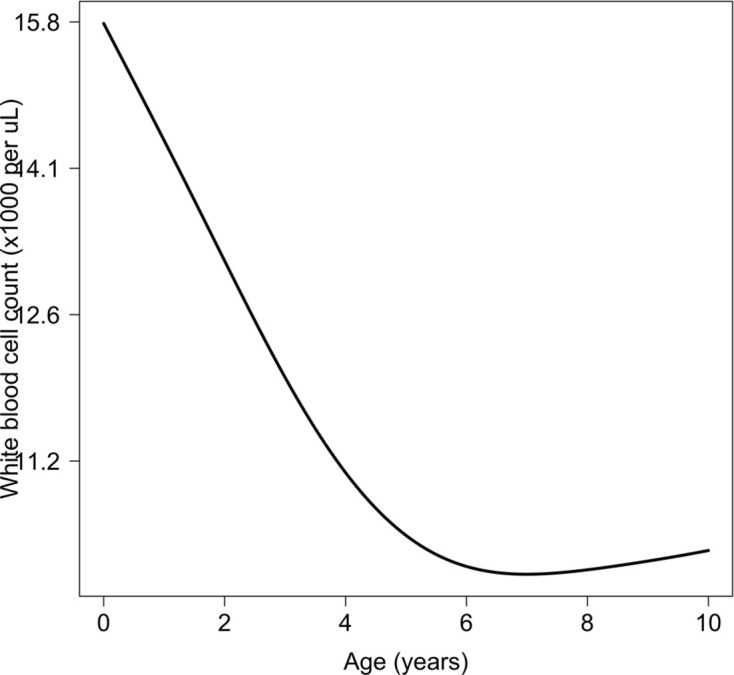
Appendix 8—figure 1. Relationship between age and mean white count (modelled on the log10 scale).

This is estimated from 858 children in the FEAST trial who had white counts available using an additive linear model ( for the smooth spline term). We used this model to adjust observed log10 white counts in all children less than 5 years of age in the reference and Kenyan datasets.
