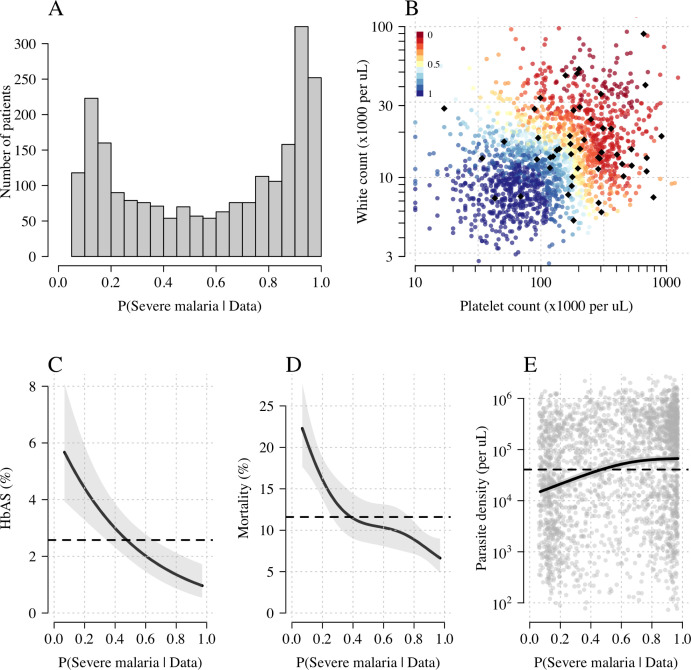
Figure 3. Model estimates of P(Severe malaria | Data) in 2220 Kenyan children clinically diagnosed with severe malaria.
Panel (A) shows the distribution of posterior probabilities of severe malaria being the correct diagnosis. Panel (B) shows these same probabilities plotted as a function of the platelet and white counts on which they are based (dark red: probability close to 0; dark blue: probability close to 1). The black diamonds show the HbAS individuals. Panels (C–E) show the relationship between the estimated probabilities of severe malaria and HbAS, in-hospital mortality and admission parasite density, respectively. The black lines (shaded areas) show the mean estimated values (95% confidence intervals) from a generalised additive logistic regression model with a smooth spline term for the likelihood (R package mgcv). The horizontal lines in panels (C–E) show the mean values in the data.

